EXHIBIT 99.2
Published on May 5, 2021
Exhibit 99.2

1 Powered by Technology. Built by Doctors. For Patients. Apollo Medical Holdings (NASDAQ:AMEH) First Quarter 2021 Earnings Call Supplement May 5, 2021
Forward - Looking Statements This presentation contains forward - looking statements within the meaning of the Private Securities Litigation Reform Act of 1995 , Section 27A of the Securities Act and Section 21E of the Exchange Act. Forward - looking statements include any statements about t he Company's business, financial condition, operating results, plans, objectives, expectations and intentions, expansion plans, int egration of acquired companies and any projections of earnings, revenue, EBITDA, Adjusted EBITDA or other financial items, such as the Company's projected capitation and future liquidity, and may be identified by the use of forward - looking terms such as “anticipa te,” “could,” “can,” “may,” “might,” “potential,” “predict,” “should,” “estimate,” “expect,” “project,” “believe,” “plan,” “envisi on, ” “intend,” “continue,” “target,” “seek,” “will,” “would,” and the negative of such terms, other variations on such terms or other simila r o r comparable words, phrases or terminology. Forward - looking statements reflect current views with respect to future events and financial performance and therefore cannot be guaranteed. Such statements are based on the current expectations and certain assumptions of the Company's management, and some or all of such expectations and assumptions may not materialize or may vary significantly from actual results. Actual results may also vary materially from forward - looking statements due to risks, uncerta inties and other factors, known and unknown, including the risk factors described from time to time in the Company’s reports to the U.S. Securities and Exchange Commission (the “SEC”), including without limitation the risk factors discussed in the Company's Annu al Report on Form 10 - K for the year ended December 31, 2020, and subsequent Quarterly Reports on Form 10 - Q. Because the factors referred to above could cause actual results or outcomes to differ materially from those expressed or imp lie d in any forward - looking statements, you should not place undue reliance on any such forward - looking statements. Any forward - looking statements speak only as of the date of this presentation and, unless legally required, the Company does not undertake any ob lig ation to update any forward - looking statement, as a result of new information, future events or otherwise. 2 www.apollomed.net
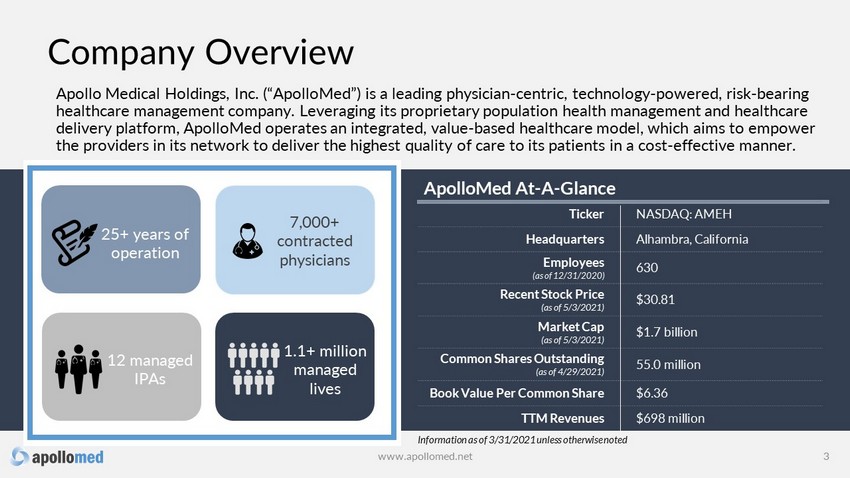
Company Overview Apollo Medical Holdings, Inc. (“ApolloMed”) is a leading physician - centric, technology - powered, risk - bearing healthcare management company. Leveraging its proprietary population health management and healthcare delivery platform, ApolloMed operates an integrated, value - based healthcare model, which aims to empower the providers in its network to deliver the highest quality of care to its patients in a cost - effective manner. 3 ApolloMed At - A - Glance Ticker NASDAQ: AMEH Headquarters Alhambra, California Employees (as of 12/31/2020) 630 Recent Stock Price ( as of 5/3/2021 ) $30.81 Market Cap (as of 5/3/2021) $1.7 bill ion Common Shares Outstanding (as of 4/29/2021) 55.0 million Book Value Per Common Share $6.36 TTM Revenues $698 million 7,000+ contracted physicians 12 managed IPAs 1.1+ million managed lives 25+ years of operation Information as of 3/31/2021 unless otherwise noted www.apollomed.net
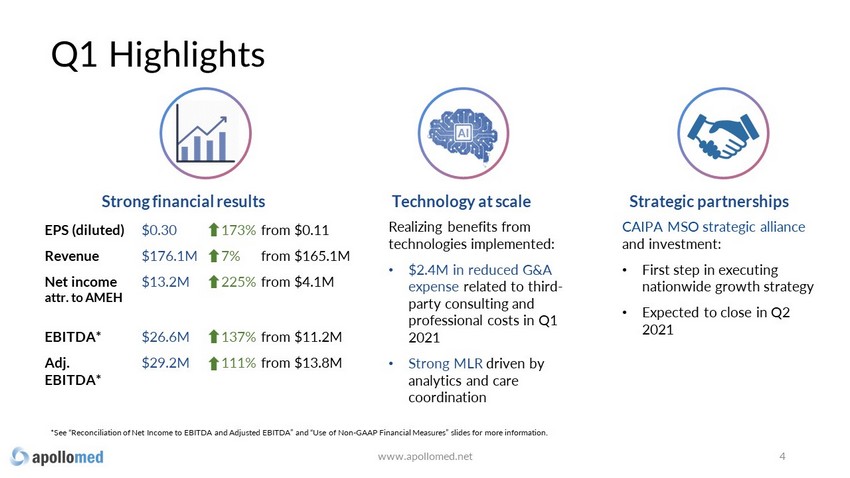
Realizing benefits from technologies implemented: • $2.4M in reduced G&A expense related to third - party consulting and professional costs in Q1 2021 • Strong MLR driven by analytics and care coordination Strong financial results Technology at scale Q1 Highlights CAIPA MSO strategic alliance and investment: • First step in executing nationwide growth strategy • Expected to close in Q2 2021 Strategic partnerships www.apollomed.net 4 *See “Reconciliation of Net Income to EBITDA and Adjusted EBITDA” and “Use of Non - GAAP Financial Measures” slides for more infor mation. EPS (diluted) $0.30 173% from $0.11 Revenue $176.1M 7% from $165.1M Net income attr . to AMEH $13.2M 225% from $4.1M EBITDA* $26.6M 137% from $11.2M Adj. EBITDA* $29.2M 111% from $13.8M
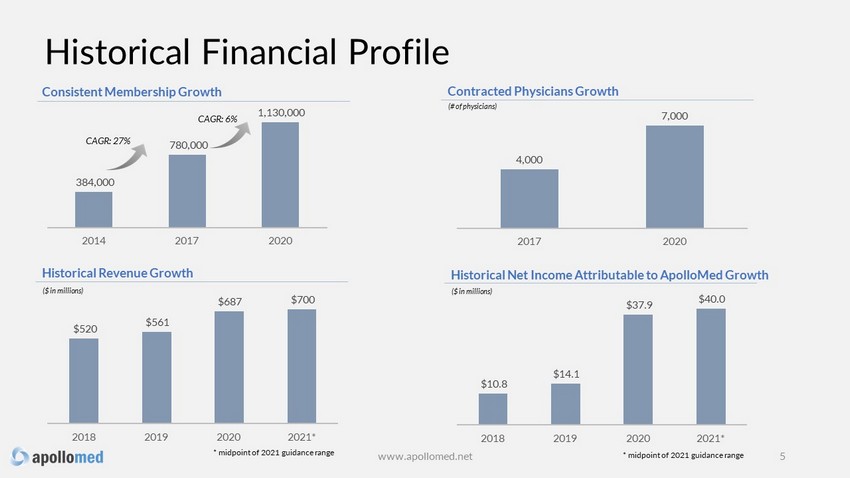
4,000 7,000 2017 2020 384,000 780,000 1,130,000 2014 2017 2020 CAGR: 27% $520 $561 $687 $700 2018 2019 2020 2021* 5 Historical Revenue Growth Consistent Membership Growth Contracted Physicians Growth ($ in millions) (# of physicians) CAGR: 6% * midpoint of 2021 guidance range $10.8 $14.1 $37.9 $40.0 2018 2019 2020 2021* Historical Net Income Attributable to ApolloMed Growth ($ in millions) Historical Financial Profile www.apollomed.net * midpoint of 2021 guidance range
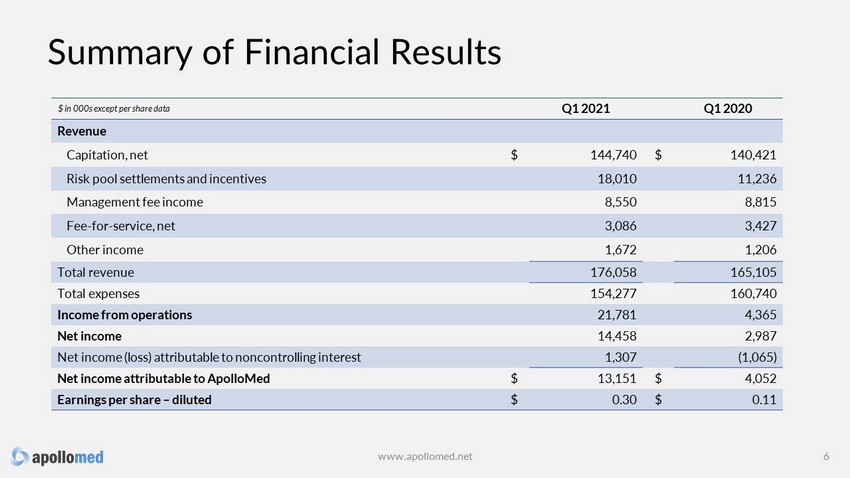
Summary of Financial Results www.apollomed.net 6 $ in 000s except per share data Q1 2021 Q1 2020 Revenue Capitation, net $ 144,740 $ 140,421 Risk pool settlements and incentives 18,010 11,236 Management fee income 8,550 8,815 Fee - for - service, net 3,086 3,427 Other income 1,672 1,206 Total revenue 176,058 165,105 Total expenses 154,277 160,740 Income from operations 21,781 4,365 Net income 14,458 2,987 Net income (loss) attributable to noncontrolling interest 1,307 (1,065) Net income attributable to ApolloMed $ 13,151 $ 4,052 Earnings per share – diluted $ 0.30 $ 0.11
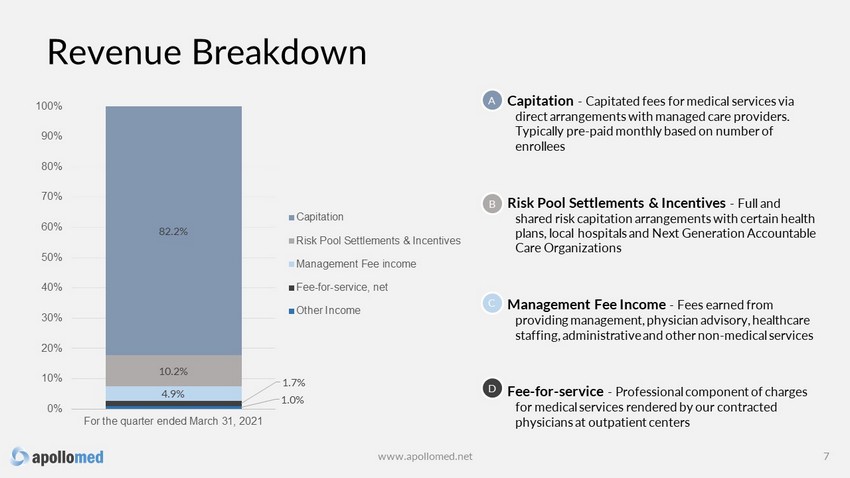
Capitation - Capitated fees for medical services via direct arrangements with managed care providers . Typically pre - paid monthly based on number of enrollees Risk Pool Settlements & Incentives - Full and shared risk capitation arrangements with certain health plans , local hospitals and Next Generation Accountable Care Organizations Management Fee Income - Fees earned from providing management, physician advisory, healthcare staffing, admin istrative and other non - medical services Fee - for - service - Professional component of charges for medical services rendered by our contracted physicians at outpatient centers 1.0% 1.7% 4.9% 10.2% 82.2% 0% 10% 20% 30% 40% 50% 60% 70% 80% 90% 100% For the quarter ended March 31, 2021 Capitation Risk Pool Settlements & Incentives Management Fee income Fee-for-service, net Other Income Revenue Breakdown 7 A B C D www.apollomed.net
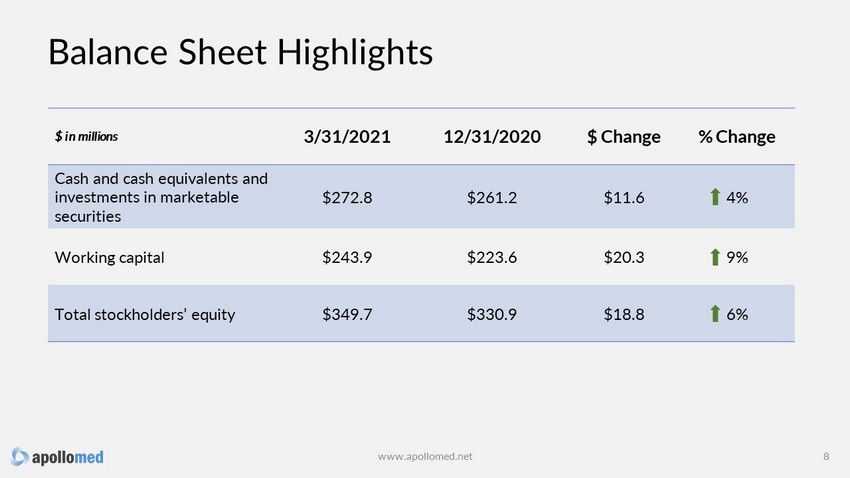
Balance Sheet Highlights 8 $ in millions 3/31/2021 12/31/2020 $ Change % Change Cash and cash equivalents and investments in marketable securities $272.8 $261.2 $11.6 4% Working capital $243.9 $223.6 $20.3 9% Total stockholders’ equity $349.7 $330.9 $18.8 6% www.apollomed.net
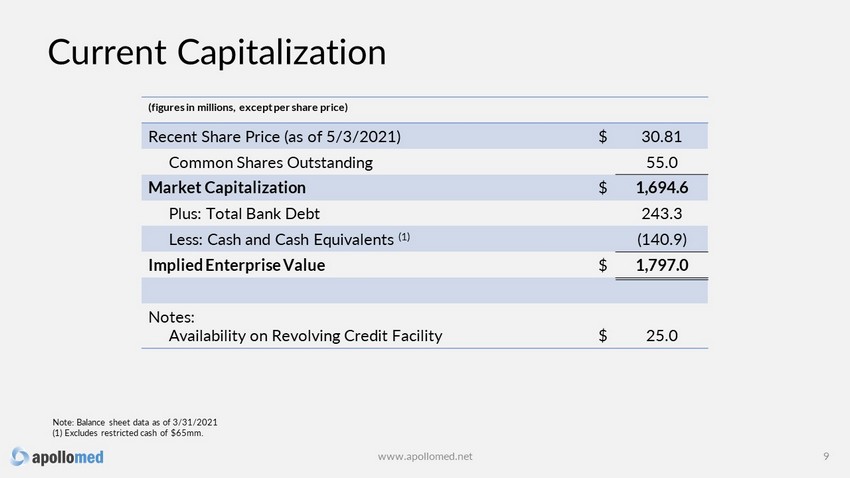
Current Capitalization 9 Note: Balance sheet data as of 3 /3 1 /202 1 (1) Excludes restricted cash of $65mm. www.apollomed.net (figures in millions, except per share price) Recent Share Price (as of 5/3/2021) $ 30.81 Common Shares Outstanding 55.0 Market Capitalization $ 1,694.6 Plus: Total Bank Debt 243.3 Less: Cash and Cash Equivalents (1) (140.9) Implied Enterprise Value $ 1,797.0 Notes: Availability on Revolving Credit Facility $ 25.0
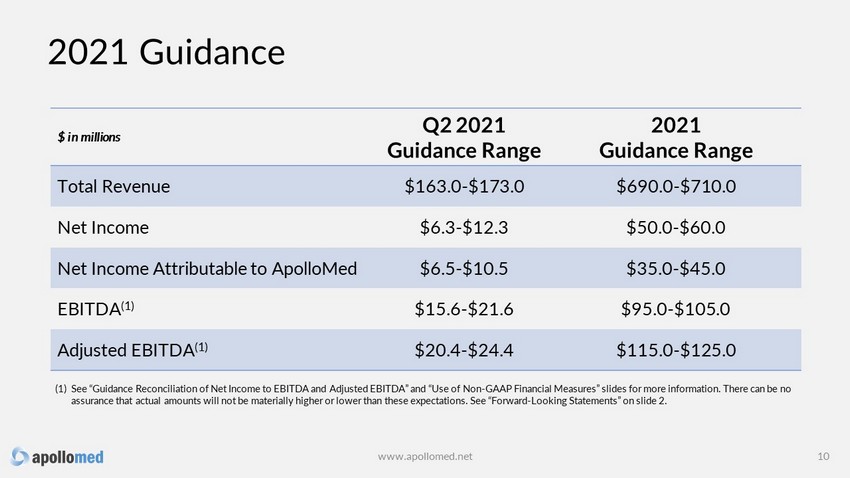
2021 Guidance $ in millions Q2 2021 Guidance Range 2021 Guidance Range Total Revenue $163.0 - $173.0 $690.0 - $710.0 Net Income $6.3 - $12.3 $50.0 - $60.0 Net Income Attributable to ApolloMed $6.5 - $10.5 $35.0 - $45.0 EBITDA (1) $15.6 - $21.6 $95.0 - $105.0 Adjusted EBITDA (1) $20.4 - $24.4 $115.0 - $125.0 10 (1) See “Guidance Reconciliation of Net Income to EBITDA and Adjusted EBITDA” and “Use of Non - GAAP Financial Measures” slides for mo re information. There can be no assurance that actual amounts will not be materially higher or lower than these expectations. See “Forward - Looking Statements” o n slide 2. www.apollomed.net
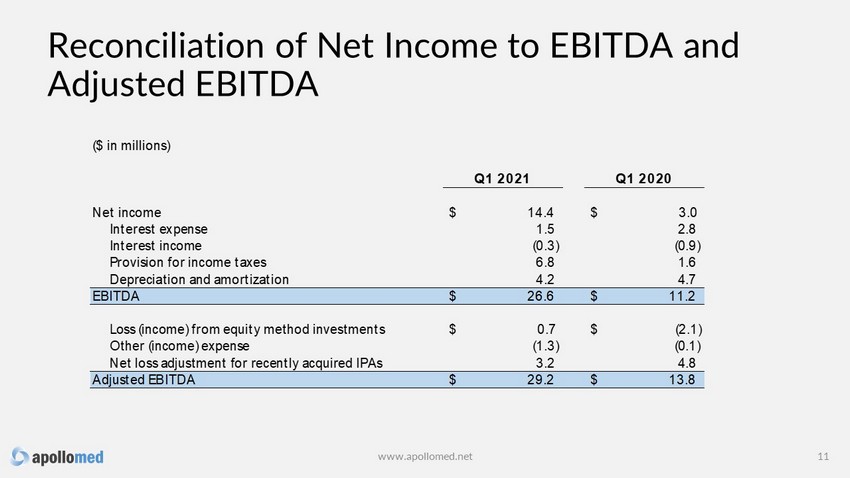
Reconciliation of Net Income to EBITDA and Adjusted EBITDA 11 www.apollomed.net Q1 2021 Q1 2020 Net income $ 14.4 $ 3.0 Interest expense 1.5 2.8 Interest income (0.3) (0.9) Provision for income taxes 6.8 1.6 Depreciation and amortization 4.2 4.7 EBITDA $ 26.6 $ 11.2 Loss (income) from equity method investments $ 0.7 $ (2.1) Other (income) expense (1.3) (0.1) Net loss adjustment for recently acquired IPAs 3.2 4.8 Adjusted EBITDA $ 29.2 $ 13.8 ($ in millions)
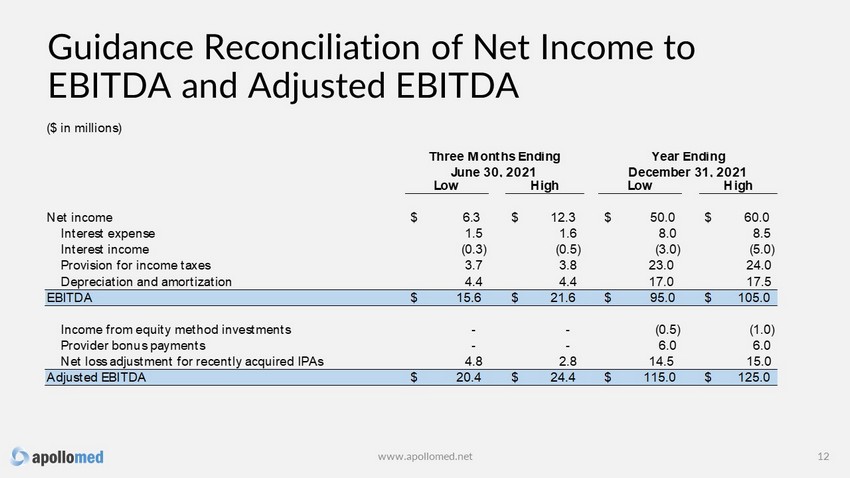
Guidance Reconciliation of Net Income to EBITDA and Adjusted EBITDA 12 www.apollomed.net Low High Low High Net income $ 6.3 $ 12.3 $ 50.0 $ 60.0 Interest expense 1.5 1.6 8.0 8.5 Interest income (0.3) (0.5) (3.0) (5.0) Provision for income taxes 3.7 3.8 23.0 24.0 Depreciation and amortization 4.4 4.4 17.0 17.5 EBITDA $ 15.6 $ 21.6 $ 95.0 $ 105.0 Income from equity method investments - - (0.5) (1.0) Provider bonus payments - - 6.0 6.0 Net loss adjustment for recently acquired IPAs 4.8 2.8 14.5 15.0 Adjusted EBITDA $ 20.4 $ 24.4 $ 115.0 $ 125.0 ($ in millions) Three Months Ending June 30, 2021 Year Ending December 31, 2021
Use of Non - GAAP Financial Measures This presentation contains the non - GAAP financial measures Earnings Before Interest, Taxes, Depreciation and Amortization (“EBIT DA”) and Adjusted EBITDA, of which the most directly comparable financial measure presented in accordance with GAAP is net (loss) income. These me asures are not in accordance with, or are an alternative to, U.S. generally accepted accounting principles (“GAAP”), and may be different from oth er non - GAAP financial measures used by other companies. ApolloMed uses Adjusted EBITDA as a supplemental performance measure of its operations, for f inancial and operational decision - making, and as a supplemental means of evaluating period - to - period comparisons on a consistent basis. Adjus ted EBITDA is calculated as earnings before interest, taxes, depreciation, and amortization, excluding losses from equity method investments provide b onu s payments, impairment of intangibles, provision of doubtful accounts and other income earned that is not related to ApolloMed's normal operations. Adj ust ed EBITDA also excludes non recurring items, including the effect on EBITDA of certain recently acquired IPAs. ApolloMed believes the presentation of these non - GAAP financial measures provides investors with relevant and useful information as it allows investors to evaluate the operating performance of the business activities without having to account for differences recognized because of no n - core and non - recurring financial information. When GAAP financial measures are viewed in conjunction with non - GAAP financial measures, investors are pr ovided with a more meaningful understanding of ApolloMed's ongoing operating performance. In addition, these non - GAAP financial measures are among those indicators ApolloMed uses as a basis for evaluating operational performance, allocating resources and planning and forecasting future pe rio ds. Non - GAAP financial measures are not intended to be considered in isolation, or as a substitute for, GAAP financial measures. To the extent this rel ease contains historical or future non - GAAP financial measures, ApolloMed has provided corresponding GAAP financial measures for comparative purposes. Recon ciliation between certain GAAP and non - GAAP measures is provided above. 13 www.apollomed.net
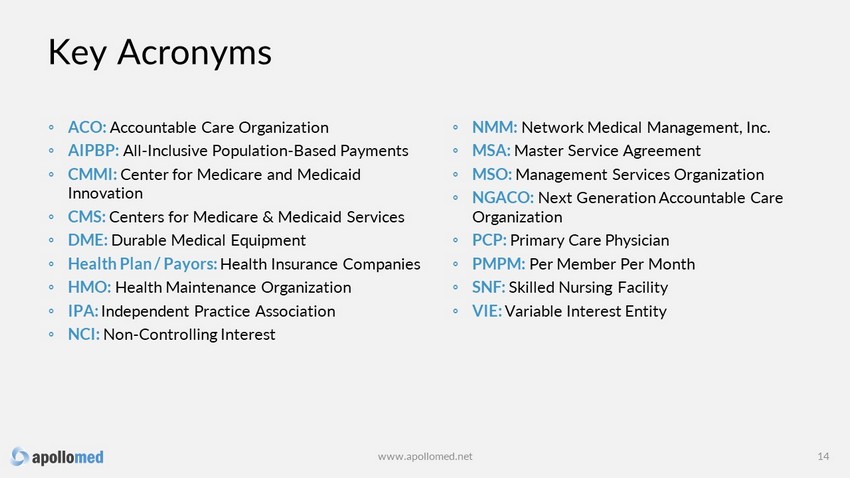
Key Acronyms 14 ◦ ACO: Accountable Care Organization ◦ AIPBP: All - Inclusive Population - Based Payments ◦ CMMI: Center for Medicare and Medicaid Innovation ◦ CMS: Centers for Medicare & Medicaid Services ◦ DME: Durable Medical Equipment ◦ Health Plan / Payors: Health Insurance Companies ◦ HMO: Health Maintenance Organization ◦ IPA: Independent Practice Association ◦ NCI: Non - Controlling Interest ◦ NMM: Network Medical Management , Inc. ◦ MSA: Master Service Agreement ◦ MSO: Management Services Organization ◦ NGACO: Next Generation Accountable Care Organization ◦ PCP: Primary Care Physician ◦ PMPM: Per Member Per Month ◦ SNF: Skilled Nursing Facility ◦ VIE: Variable Interest Entity www.apollomed.net

15 For inquiries, please contact: ApolloMed Investor Relations (626) 943 - 6491 investors@apollomed.net Carolyne Sohn, The Equity Group (415) 568 - 2255 csohn@equityny.com