EXHIBIT 99.1
Published on January 12, 2022
Exhibit 99.1

Apollo Medical Holdings January 2022 Powered by Technology. Built by Doctors. For Patients.
This presentation contains forward - looking statements within the meaning of the Private Securities Litigation Reform Act of 1995, Section 27A of the Securities Act and Section 21E of the Exchange Act. Forward - looking statements include any statements about the Company's business, financial condition, operating results, plans, objectives, expectations and intentions, expansion plans, integration of acquired companies and any projections of earnings, revenue, EBITDA, Adjusted EBITDA or other financial items, such as the Company's projected capitation and future liquidity, and may be identified by the use of forward - looking terms such as “anticipate,” “could,” “can,” “may,” “might,” “potential,” “predict,” “should,” “estimate,” “expect,” “project,” “believe,” “plan,” “envision,” “intend,” “continue,” “target,” “seek,” “will,” “would,” and the negative of such terms, other variations on such terms or other similar or comparable words, phrases or terminology. Forward - looking statements reflect current views with respect to future events and financial performance and therefore cannot be guaranteed. Such statements are based on the current expectations and certain assumptions of the Company's management, and some or all of such expectations and assumptions may not materialize or may vary significantly from actual results. Actual results may also vary materially from forward - looking statements due to risks, uncertainties and other factors, known and unknown, including the risk factors described from time to time in the Company’s reports to the U.S. Securities and Exchange Commission (the “SEC”), including without limitation the risk factors discussed in the Company's Annual Report on Form 10 - K for the year ended December 31, 2020, and subsequent Quarterly Reports on Form 10 - Q. Because the factors referred to above could cause actual results or outcomes to differ materially from those expressed or implied in any forward - looking statements, you should not place undue reliance on any such forward - looking statements. Any forward - looking statements speak only as of the date of this presentation and, unless legally required, the Company does not undertake any obligation to update any forward - looking statement, as a result of new information, future events or otherwise. Forward - looking statements 2
Key acronyms 3 ◦ ACO: Accountable Care Organization ◦ AIPBP: All - Inclusive Population - Based Payments ◦ APC: Allied Physicians of California IPA ◦ CMMI: Center for Medicare and Medicaid Innovation ◦ CMS: Centers for Medicare & Medicaid Services ◦ DC: Direct Contracting ◦ DCE: Direct Contracting Entity ◦ DME: Durable Medical Equipment ◦ Health Plan / Payors: Health Insurance Companies ◦ HMO: Health Maintenance Organization ◦ IPA: Independent Practice Association ◦ NCI: Non - Controlling Interest ◦ NMM: Network Medical Management, Inc. ◦ MSA: Master Service Agreement ◦ MSO: Management Services Organization ◦ NGACO: Next Generation Accountable Care Organization ◦ PCP: Primary Care Physician ◦ PMPM: Per Member Per Month ◦ SNF: Skilled Nursing Facility ◦ VIE: Variable Interest Entity
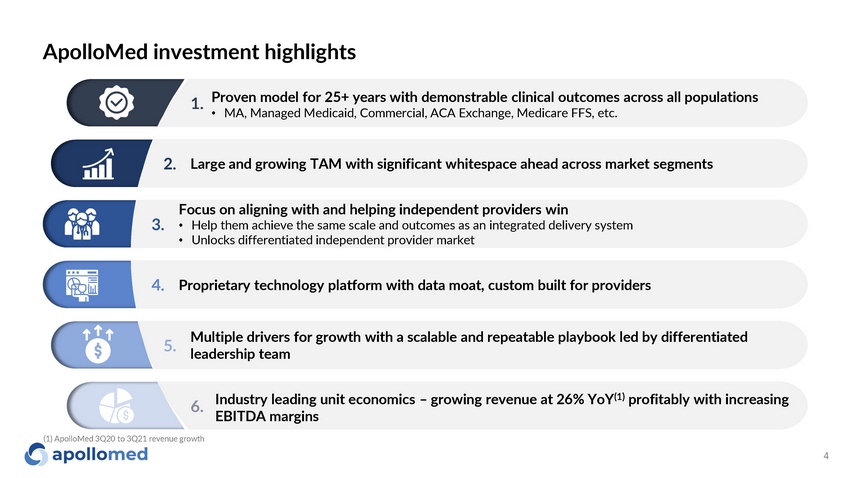
ApolloMed investment highlights 1. Proven model for 25+ years with demonstrable clinical outcomes across all populations • MA, Managed Medicaid, Commercial, ACA Exchange, Medicare FFS, etc. 2. Focus on aligning with and helping independent providers win 3. • Help them achieve the same scale and outcomes as an integrated delivery system • Unlocks differentiated independent provider market 5. 6. 4. Industry leading unit economics – growing revenue at 26% YoY (1) profitably with increasing EBITDA margins 4 Proprietary technology platform with data moat, custom built for providers Multiple drivers for growth with a scalable and repeatable playbook led by differentiated leadership team Large and growing TAM with significant whitespace ahead across market segments (1) ApolloMed 3Q20 to 3Q21 revenue growth
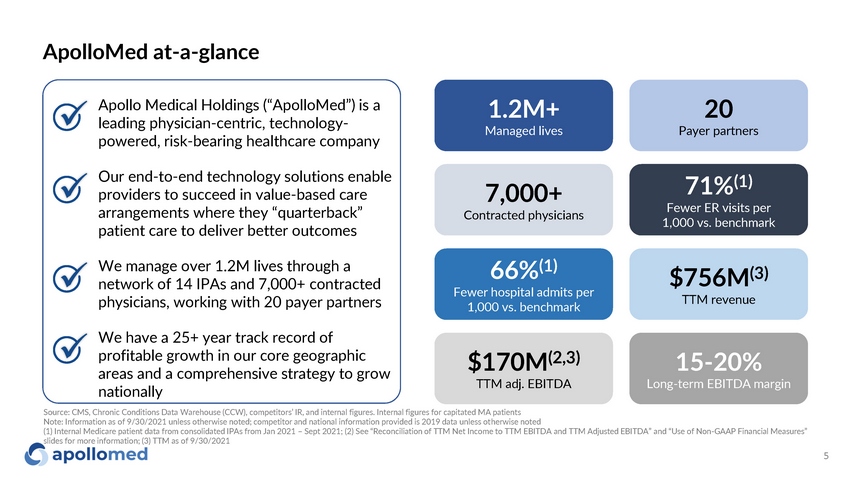
66% (1) Fewer hospital admits per 1,000 vs. benchmark $756M (3) TTM revenue $170M (2,3) TTM adj. EBITDA 15 - 20% Long - term EBITDA margin ApolloMed at - a - glance 71% (1) Fewer ER visits per 1,000 vs. benchmark 7,000+ Contracted physicians x x x x 1.2M+ Managed lives 20 Payer partners 5 Apollo Medical Holdings (“ApolloMed”) is a leading physician - centric, technology - powered, risk - bearing healthcare company Our end - to - end technology solutions enable providers to succeed in value - based care arrangements where they “quarterback” patient care to deliver better outcomes We manage over 1.2M lives through a network of 14 IPAs and 7,000+ contracted physicians, working with 20 payer partners We have a 25+ year track record of profitable growth in our core geographic areas and a comprehensive strategy to grow nationally Source: CMS, Chronic Conditions Data Warehouse (CCW), competitors’ IR, and internal figures. Internal figures for capitated MA patients Note: Information as of 9/30/2021 unless otherwise noted; competitor and national information provided is 2019 data unless otherwise noted (1) Internal Medicare patient data from consolidated IPAs from Jan 2021 – Sept 2021; (2) See “Reconciliation of TTM Net Income to TTM EBITDA and TTM Adjusted EBITDA” and “Use of Non - GAAP Financial Measures” slides for more information; (3) TTM as of 9/30/2021
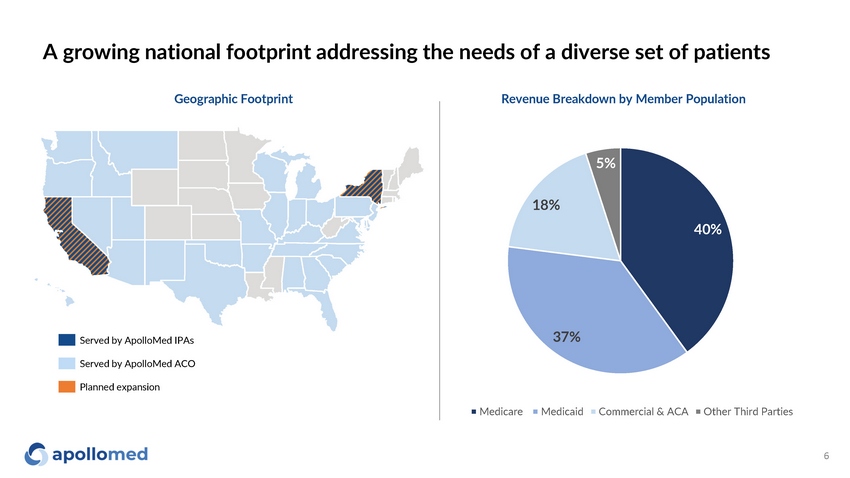
40% 37% 18% 5% Medicare M e dic a id Commercial & ACA Other Third Parties A growing national footprint addressing the needs of a diverse set of patients Served by ApolloMed IPAs Served by ApolloMed ACO Planned expansion Geographic Footprint Revenue Breakdown by Member Population 6
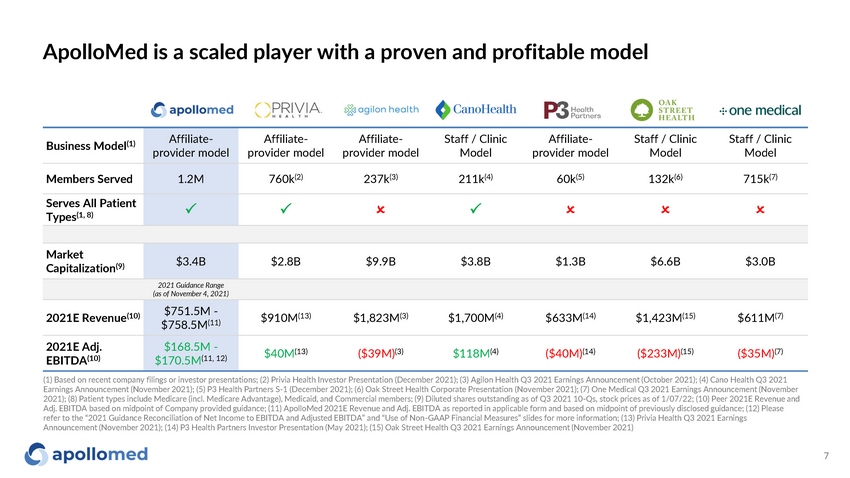
ApolloMed is a scaled player with a proven and profitable model Business Model (1) Affiliate - provider model Affiliate - provider model Affiliate - provider model Staff / Clinic Model Affiliate - provider model Staff / Clinic Model Staff / Clinic Model Members Served 1.2M 760k (2) 237k (3) 211k (4) 60k (5) 132k (6) 715k (7) Serves All Patient Types (1, 8) P P O P O O O Market Capitalization (9) $3.4B $2.8B $9.9B $3.8B $1.3B $6.6B $3.0B 2021 Guidance Range (as of November 4, 2021) 2021E Revenue (10) $751.5M - $758.5M (11) $910M (13) $1,823M (3) $1,700M (4) $633M (14) $1,423M (15) $611M (7) 2021E Adj. EBITDA (10) $168.5M - $170.5M (11, 12) $40M (13) ($39M) (3) $118M (4) ($40M) (14) ($233M) (15) ($35M) (7) 7 (1) Based on recent company filings or investor presentations; (2) Privia Health Investor Presentation (December 2021); (3) Agilon Health Q3 2021 Earnings Announcement (October 2021); (4) Cano Health Q3 2021 Earnings Announcement (November 2021); (5) P3 Health Partners S - 1 (December 2021); (6) Oak Street Health Corporate Presentation (November 2021); (7) One Medical Q3 2021 Earnings Announcement (November 2021); (8) Patient types include Medicare (incl. Medicare Advantage), Medicaid, and Commercial members; (9) Diluted shares outstanding as of Q3 2021 10 - Qs, stock prices as of 1/07/22; (10) Peer 2021E Revenue and Adj. EBITDA based on midpoint of Company provided guidance; (11) ApolloMed 2021E Revenue and Adj. EBITDA as reported in applicable form and based on midpoint of previously disclosed guidance; (12) Please refer to the “2021 Guidance Reconciliation of Net Income to EBITDA and Adjusted EBITDA” and “Use of Non - GAAP Financial Measures” slides for more information; (13) Privia Health Q3 2021 Earnings Announcement (November 2021); (14) P3 Health Partners Investor Presentation (May 2021); (15) Oak Street Health Q3 2021 Earnings Announcement (November 2021)

Industry overview
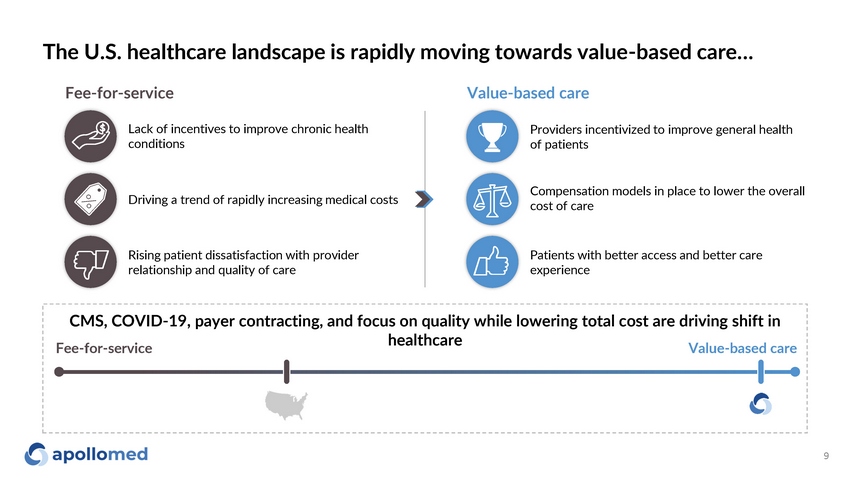
The U.S. healthcare landscape is rapidly moving towards value - based care… Fee - for - service Value - based care Lack of incentives to improve chronic health conditions Driving a trend of rapidly increasing medical costs Rising patient dissatisfaction with provider relationship and quality of care Providers incentivized to improve general health of patients Compensation models in place to lower the overall cost of care Patients with better access and better care experience CMS, COVID - 19, payer contracting, and focus on quality while lowering total cost are driving shift in healthcare Fee - for - service Value - based care 9
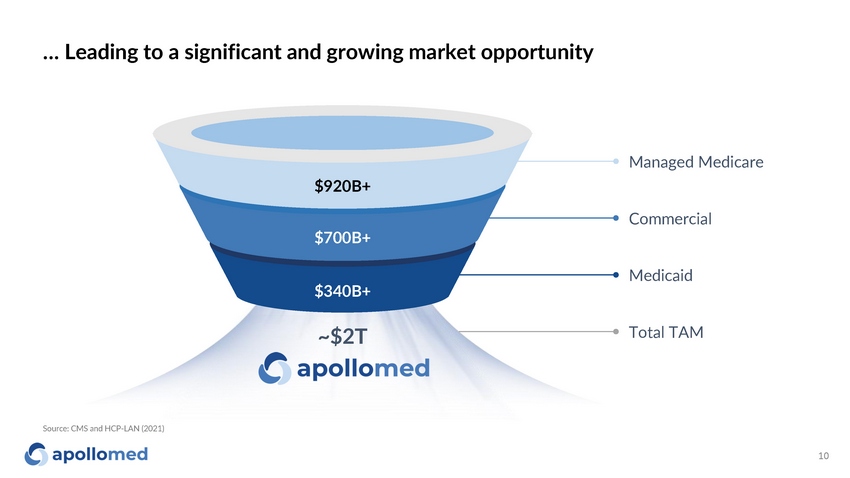
… Leading to a significant and growing market opportunity Source: CMS and HCP - LAN (2021) $920B+ $700B+ $340B+ Managed Medicare Co m m erc ia l M e dic a id Total TAM ~$2T 10
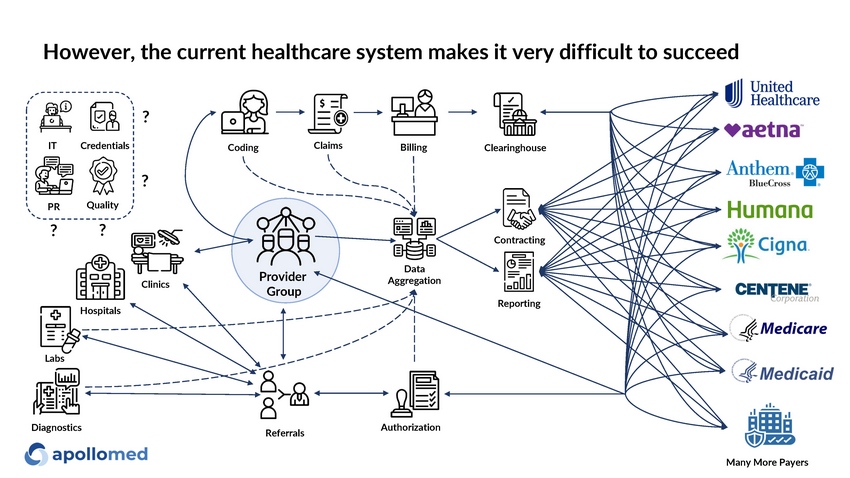
Reporting Con t r a c t i ng Claims Data Aggregation B i lling Co d i ng Ho s p i tals Clinics R e fer r al s P rovid e r Group Author i zat i on Clea r i n g hou s e IT Cr e dent i al s Quality ? PR ? ? ? L abs Many More Payers D i ag nos ti c s However, the current healthcare system makes it very difficult to succeed

Platform overview
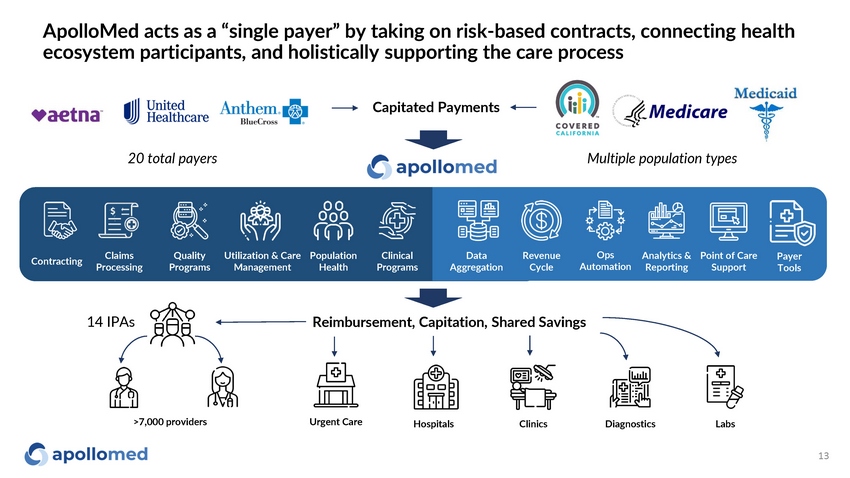
ApolloMed acts as a “single payer” by taking on risk - based contracts, connecting health ecosystem participants, and holistically supporting the care process 13 Capitated Payments Utilization & Care Management Claims Pro c es s i ng Ops Automat i on Point of Care Support Analytics & Reporting Con t r ac ti ng Clinical Programs Quality Programs Popula t i on Health Data Aggregation R e v enue Cycle P a y er Tools Reimbursement, Capitation, Shared Savings >7,000 providers Ho s p i tals L abs Urgent Care Clin i c s D i ag nos ti c s 20 total payers 14 IPAs Multiple population types
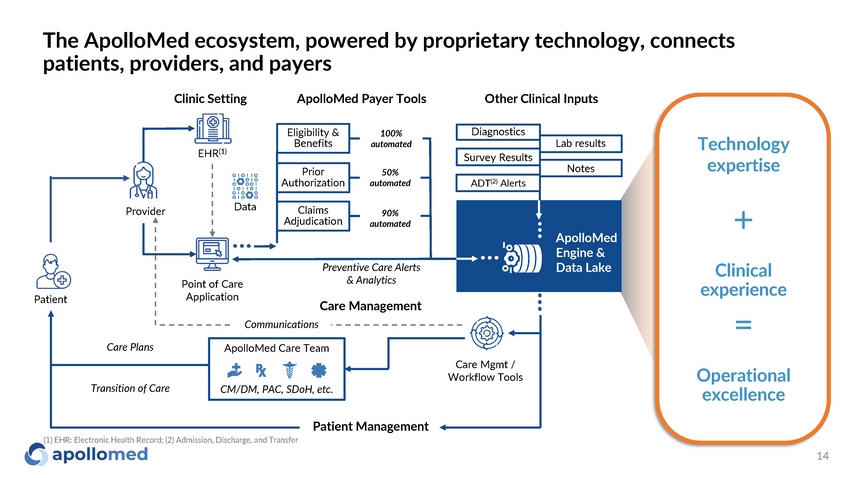
The ApolloMed ecosystem, powered by proprietary technology, connects patients, providers, and payers 14 P r o v ider Point of Care Application EHR (1) Dat a Patient Care Management ApolloMed Care Team Patient Management CM/DM, PAC, SDoH, etc. Communications Care Mgmt / Workflow Tools Eligibility & Benefits Prior Aut h o r ization Claims Adjudication Clinic Setting ApolloMed Payer Tools Other Clinical Inputs 100% au t o ma t e d 50% au t o ma t e d 90% a u t oma t e d Technology expertise Operat i onal excellence Clinical expe r i e nce + = A p o l l o M e d Engine & Data Lake Diagnostics Lab results Survey Results Notes ADT (2) Alerts (1) EHR: Electronic Health Record; (2) Admission, Discharge, and Transfer Care Plans Transition of Care Preventive Care Alerts & Analytics
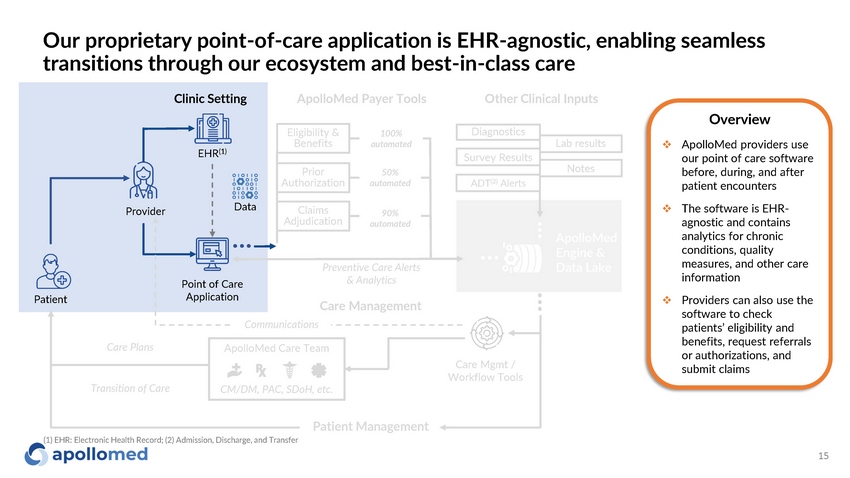
Our proprietary point - of - care application is EHR - agnostic, enabling seamless transitions through our ecosystem and best - in - class care P r o v ider Point of Care Application Dat a Patient Care Management CM/DM, PAC, SDoH, etc. Communications Care Mgmt / Workflow Tools ApolloMed Care Team Overview □ ApolloMed providers use our point of care software before, during, and after patient encounters □ The software is EHR - agnostic and contains analytics for chronic conditions, quality measures, and other care information □ Providers can also use the software to check patients’ eligibility and benefits, request referrals or authorizations, and submit claims Eligibility & Benefits Prior Aut h o r ization Claims Adjudication 100% au t o ma t e d 50% au t o ma t e d 90% a u t oma t e d Clinic Setting ApolloMed Payer Tools Other Clinical Inputs A p o l l o M e d Engine & Data Lake Diagnostics Lab results Survey Results Notes ADT (2) Alerts Patient Management (1) EHR: Electronic Health Record; (2) Admission, Discharge, and Transfer 15 EHR (1) Care Plans Transition of Care Preventive Care Alerts & Analytics
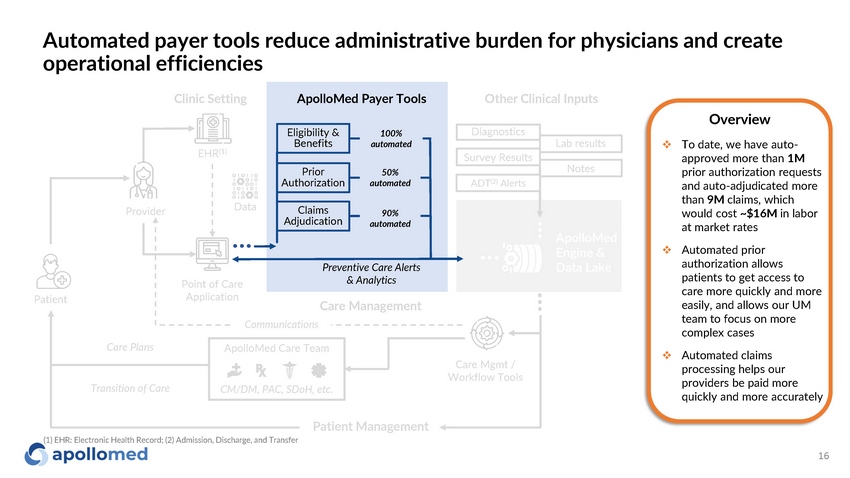
Automated payer tools reduce administrative burden for physicians and create operational efficiencies P r o v ider Point of Care Application EHR (1) Dat a Patient Care Management CM/DM, PAC, SDoH, etc. Communications Care Mgmt / Workflow Tools Preventive Care Alerts & Analytics ApolloMed Care Team Overview □ To date, we have auto - approved more than 1M prior authorization requests and auto - adjudicated more than 9M claims, which would cost ~$16M in labor at market rates □ Automated prior authorization allows patients to get access to care more quickly and more easily, and allows our UM team to focus on more complex cases □ Automated claims processing helps our providers be paid more quickly and more accurately Eligibility & Benefits Prior Aut h o r ization Claims Adjudication Clinic Setting ApolloMed Payer Tools Other Clinical Inputs 100% au t o ma t e d 50% au t o ma t e d 90% a u t oma t e d A p o l l o M e d Engine & Data Lake Diagnostics Lab results Survey Results Notes ADT (2) Alerts Patient Management (1) EHR: Electronic Health Record; (2) Admission, Discharge, and Transfer 16 Care Plans Transition of Care
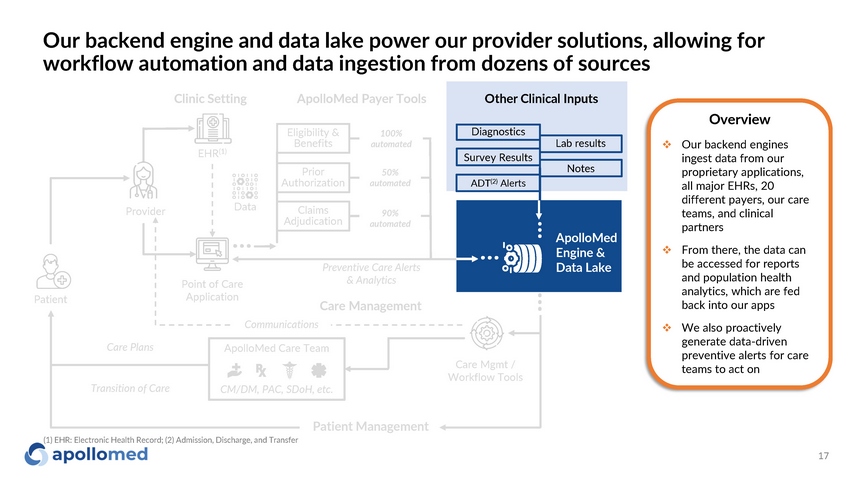
Our backend engine and data lake power our provider solutions, allowing for workflow automation and data ingestion from dozens of sources P r o v ider Point of Care Application Dat a Patient Care Management Communications Care Mgmt / Workflow Tools A p o l l o M e d Engine & Data Lake Preventive Care Alerts & Analytics CM/DM, PAC, SDoH, etc. ApolloMed Care Team Overview □ Our backend engines ingest data from our proprietary applications, all major EHRs, 20 different payers, our care teams, and clinical partners □ From there, the data can be accessed for reports and population health analytics, which are fed back into our apps □ We also proactively generate data - driven preventive alerts for care teams to act on Eligibility & Benefits Prior Aut h o r ization Claims Adjudication 100% au t o ma t e d 50% au t o ma t e d 90% a u t oma t e d Clinic Setting ApolloMed Payer Tools Other Clinical Inputs Diagnostics Lab results Survey Results Notes ADT (2) Alerts Patient Management (1) EHR: Electronic Health Record; (2) Admission, Discharge, and Transfer 17 EHR (1) Care Plans Transition of Care
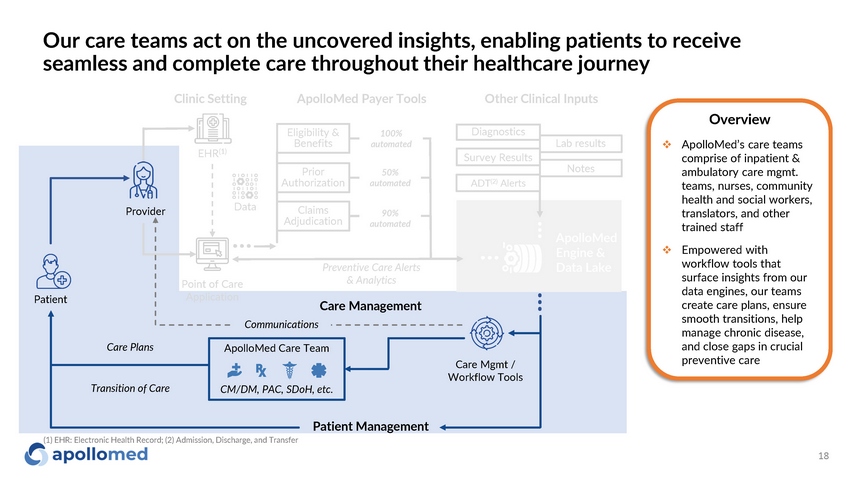
Our care teams act on the uncovered insights, enabling patients to receive seamless and complete care throughout their healthcare journey P r o v ider Point of Care Application Dat a Patient Care Management ApolloMed Care Team CM/DM, PAC, SDoH, etc. Communications Care Mgmt / Workflow Tools A p o l l o M e d Engine & Data Lake Preventive Care Alerts & Analytics Clinic Setting ApolloMed Payer Tools Other Clinical Inputs Overview □ ApolloMed’s care teams comprise of inpatient & ambulatory care mgmt. teams, nurses, community health and social workers, translators, and other trained staff □ Empowered with workflow tools that surface insights from our data engines, our teams create care plans, ensure smooth transitions, help manage chronic disease, and close gaps in crucial preventive care Eligibility & Benefits Prior Aut h o r ization Claims Adjudication 100% au t o ma t e d 50% au t o ma t e d 90% a u t oma t e d Diagnostics Lab results Survey Results Notes ADT (2) Alerts Patient Management (1) EHR: Electronic Health Record; (2) Admission, Discharge, and Transfer 18 EHR (1) Care Plans Transition of Care
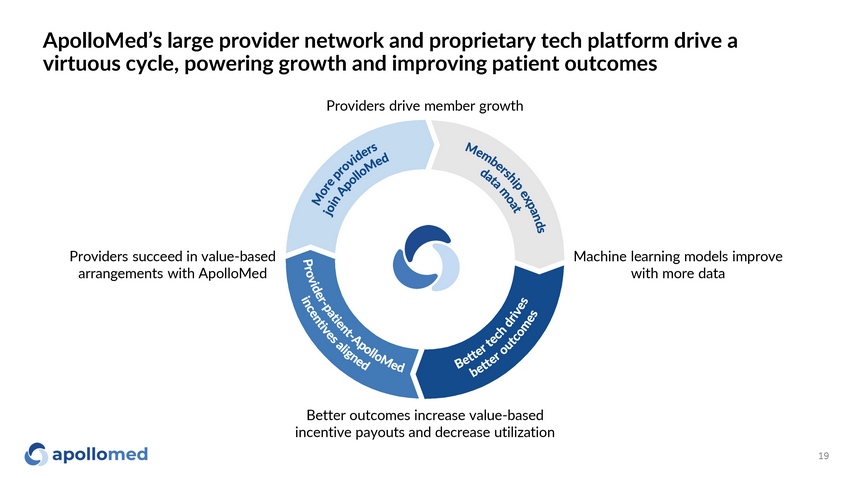
ApolloMed’s large provider network and proprietary tech platform drive a virtuous cycle, powering growth and improving patient outcomes Better outcomes increase value - based incentive payouts and decrease utilization Machine learning models improve with more data Providers succeed in value - based arrangements with ApolloMed Providers drive member growth 19
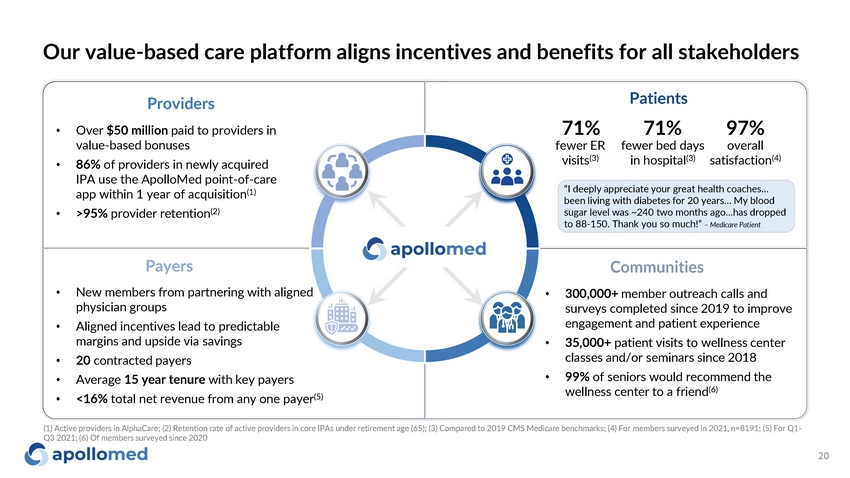
Our value - based care platform aligns incentives and benefits for all stakeholders Communities • 300,000+ member outreach calls and surveys completed since 2019 to improve engagement and patient experience • 35,000+ patient visits to wellness center classes and/or seminars since 2018 • 99% of seniors would recommend the wellness center to a friend (6) Payers • New members from partnering with aligned physician groups • Aligned incentives lead to predictable margins and upside via savings • 20 contracted payers • Average 15 year tenure with key payers • <16% total net revenue from any one payer (5) Providers • Over $50 million paid to providers in value - based bonuses • 86% of providers in newly acquired IPA use the ApolloMed point - of - care app within 1 year of acquisition (1) • >95% provider retention (2) “I deeply appreciate your great health coaches… been living with diabetes for 20 years… My blood sugar level was ~240 two months ago…has dropped to 88 - 150. Thank you so much!” – Medicare Patient 20 71% fewer ER visits (3) Patients 71 % 97% fewe r b ed d a ys o v er all in hospital (3) satisfaction (4) (1) Active providers in AlphaCare; (2) Retention rate of active providers in core IPAs under retirement age (65); (3) Compared to 2019 CMS Medicare benchmarks; (4) For members surveyed in 2021, n=8191; (5) For Q1 - Q3 2021; (6) Of members surveyed since 2020

Clinical and financial outcomes
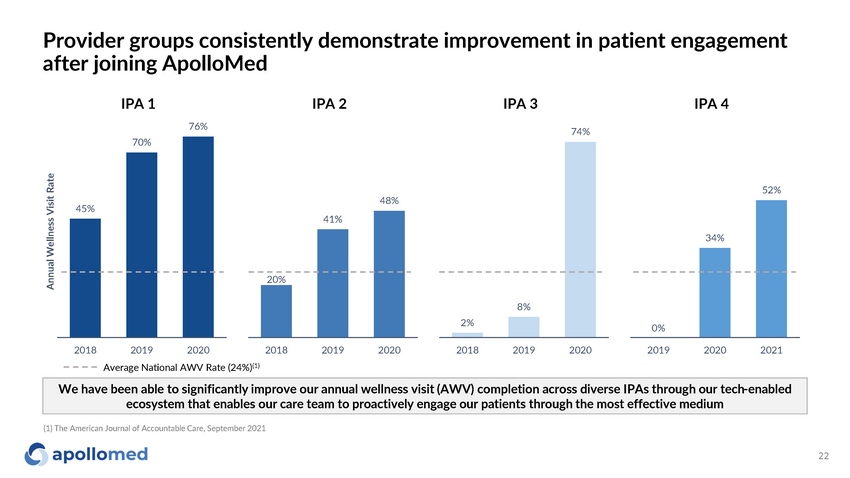
Provider groups consistently demonstrate improvement in patient engagement after joining ApolloMed 45% 70% IPA 1 IPA 2 IPA 3 IPA 4 76% Annual Wellness Visit Rate 20% 41% 48% 20 1 8 20 1 9 20 2 0 2% 8% 74% 20 1 8 2 0 1 9 20 2 0 0% 34% 52% 20 1 9 20 2 0 20 2 1 We have been able to significantly improve our annual wellness visit (AWV) completion across diverse IPAs through our tech - enabled ecosystem that enables our care team to proactively engage our patients through the most effective medium 2018 2019 2020 Average National AWV Rate (24%) (1) 22 (1) The American Journal of Accountable Care, September 2021
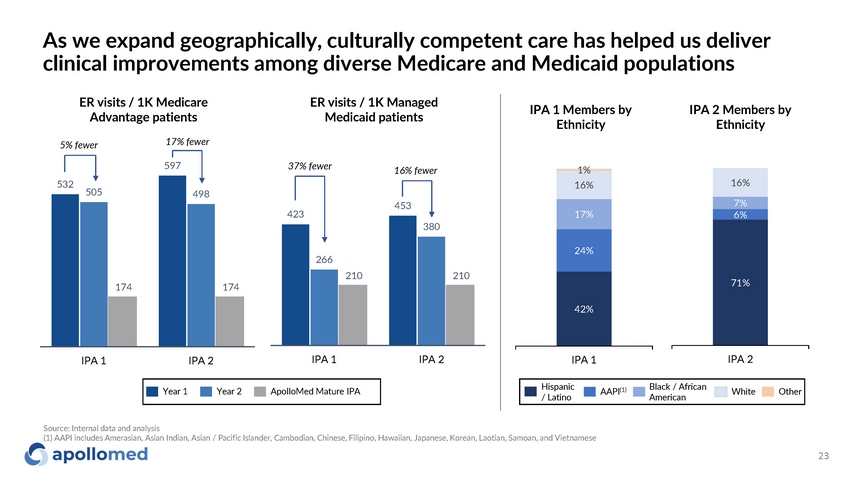
532 597 505 498 174 174 IPA 1 IPA 2 As we expand geographically, culturally competent care has helped us deliver clinical improvements among diverse Medicare and Medicaid populations ER visits / 1K Medicare Advantage patients ER visits / 1K Managed Medicaid patients 423 453 266 380 210 210 IPA 1 IPA 2 42% 24% 17% 16% 1% IPA 1 71% 6% 7% 16% IPA 2 IPA 1 Members by Ethnicity IPA 2 Members by Ethnicity Year 1 Year 2 ApolloMed Mature IPA H is p a n ic / Latino AAPI (1) Black / African American W h it e O ther 5% fewer 17% fewer 37% fewer 16% fewer Source: Internal data and analysis (1) AAPI includes Amerasian, Asian Indian, Asian / Pacific Islander, Cambodian, Chinese, Filipino, Hawaiian, Japanese, Korean, Laotian, Samoan, and Vietnamese 23
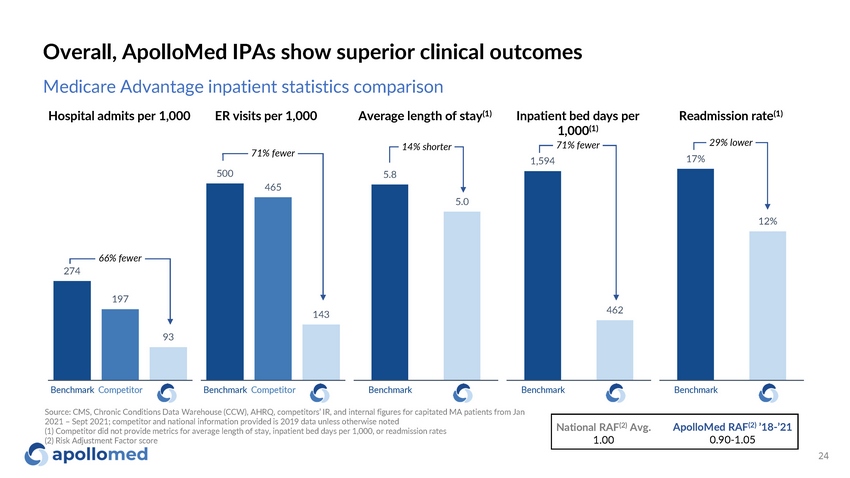
Overall, ApolloMed IPAs show superior clinical outcomes National RAF (2) Avg. 1.00 ApolloMed RAF (2) ’18 - ’21 0.90 - 1.05 Medicare Advantage inpatient statistics comparison Hospital admits per 1,000 ER visits per 1,000 Average length of stay (1) Inpatient bed days per 1,000 (1) Readmission rate (1) 93 66% fewer 274 197 500 465 143 71% fewer 5 . 8 5 . 0 14% shorter 1 ,5 9 4 462 B ench m a rk C o m p et it or B ench m a rk C o m p et it or B ench m a rk B ench m a rk 71% fewer 17% 12% B ench m a rk 29% lower Source: CMS, Chronic Conditions Data Warehouse (CCW), AHRQ, competitors’ IR, and internal figures for capitated MA patients from Jan 2021 – Sept 2021; competitor and national information provided is 2019 data unless otherwise noted (1) Competitor did not provide metrics for average length of stay, inpatient bed days per 1,000, or readmission rates (2) Risk Adjustment Factor score 24
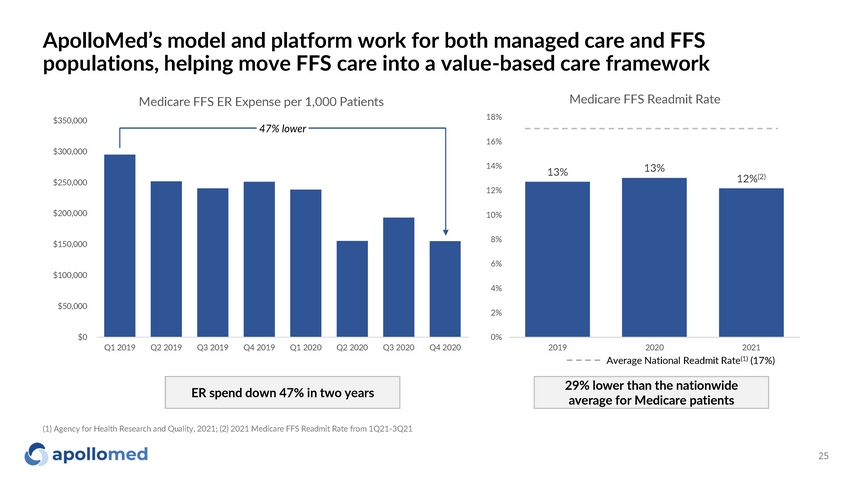
ApolloMed’s model and platform work for both managed care and FFS populations, helping move FFS care into a value - based care framework $0 $ 5 0 , 0 0 0 $ 1 0 0 ,0 0 0 $ 1 5 0 ,0 0 0 $ 2 0 0 ,0 0 0 $ 2 5 0 ,0 0 0 $ 3 0 0 ,0 0 0 $ 3 5 0 ,0 0 0 Q1 2019 Q2 2019 Q3 2019 Q4 2019 Q1 2020 Q2 2020 Q3 2020 Q4 2020 Medicare FFS ER Expense per 1,000 Patients 47% lower 13% 25 13% 12% (2) 0% 2% 4% 6% 8% 1 0 % 1 2 % 1 4 % 1 6 % 1 8 % Medicare FFS Readmit Rate 2019 2020 2021 Average National Readmit Rate (1) (17%) (1) Agency for Health Research and Quality, 2021; (2) 2021 Medicare FFS Readmit Rate from 1Q21 - 3Q21 ER spend down 47% in two years 29% lower than the nationwide average for Medicare patients
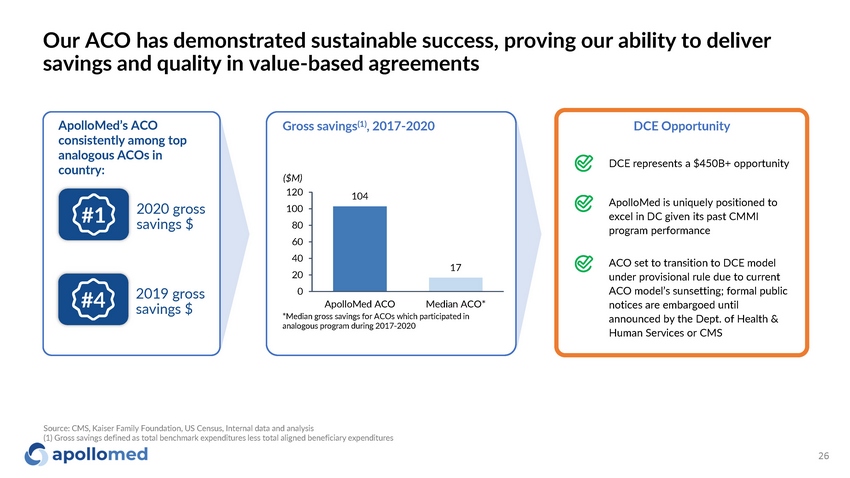
Our ACO has demonstrated sustainable success, proving our ability to deliver savings and quality in value - based agreements ApolloMed’s ACO consistently among top analogous ACOs in country: 2020 gross savings $ 2019 gross savings $ Gross savings (1) , 2017 - 2020 104 17 ApolloMed ACO Median ACO* *Median gross savings for ACOs which participated in analogous program during 2017 - 2020 ($M) 120 100 80 60 40 20 0 #1 #4 Source: CMS, Kaiser Family Foundation, US Census, Internal data and analysis (1) Gross savings defined as total benchmark expenditures less total aligned beneficiary expenditures 26 DCE represents a $450B+ opportunity DCE Opportunity ApolloMed is uniquely positioned to excel in DC given its past CMMI program performance ACO set to transition to DCE model under provisional rule due to current ACO model’s sunsetting; formal public notices are embargoed until announced by the Dept. of Health & Human Services or CMS

Growth strategy
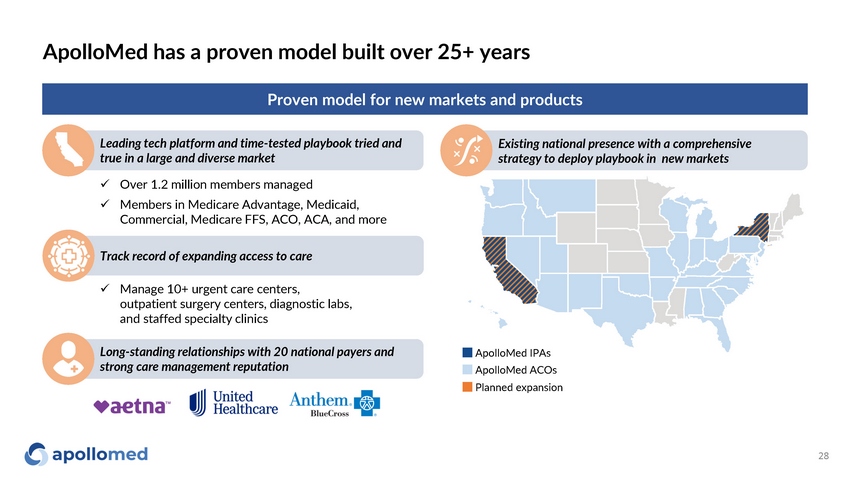
ApolloMed has a proven model built over 25+ years Leading tech platform and time - tested playbook tried and true in a large and diverse market Existing national presence with a comprehensive strategy to deploy playbook in new markets Proven model for new markets and products Long - standing relationships with 20 national payers and strong care management reputation ApolloMed IPAs ApolloMed ACOs Planned expansion x Over 1.2 million members managed x Members in Medicare Advantage, Medicaid, Commercial, Medicare FFS, ACO, ACA, and more Track record of expanding access to care x Manage 10+ urgent care centers, outpatient surgery centers, diagnostic labs, and staffed specialty clinics 28
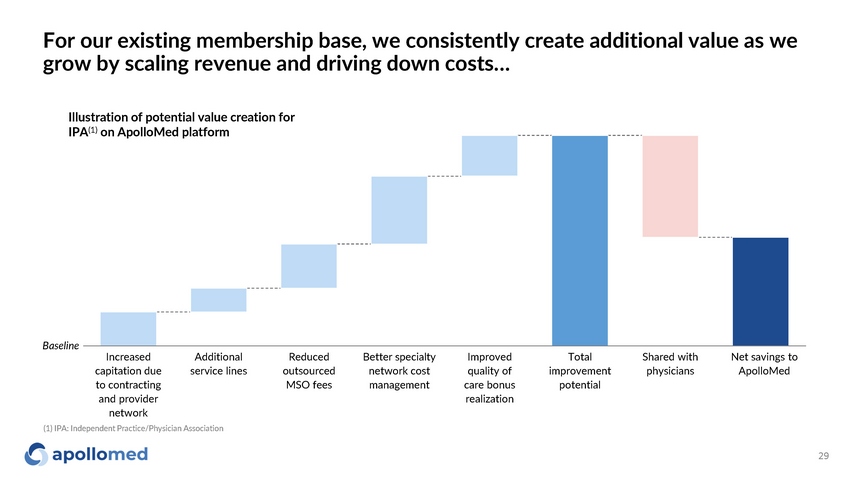
For our existing membership base, we consistently create additional value as we grow by scaling revenue and driving down costs… Increased Additional Reduced Better specialty I m p r oved Total Shared with Net savings to capitation due service lines outsourced network cost quality of improvement physicians ApolloMed to contracting MSO fees management care bonus potential and provider r ealization network 29 Illustration of potential value creation for IPA (1) on ApolloMed platform Basel ine (1) IPA: Independent Practice/Physician Association
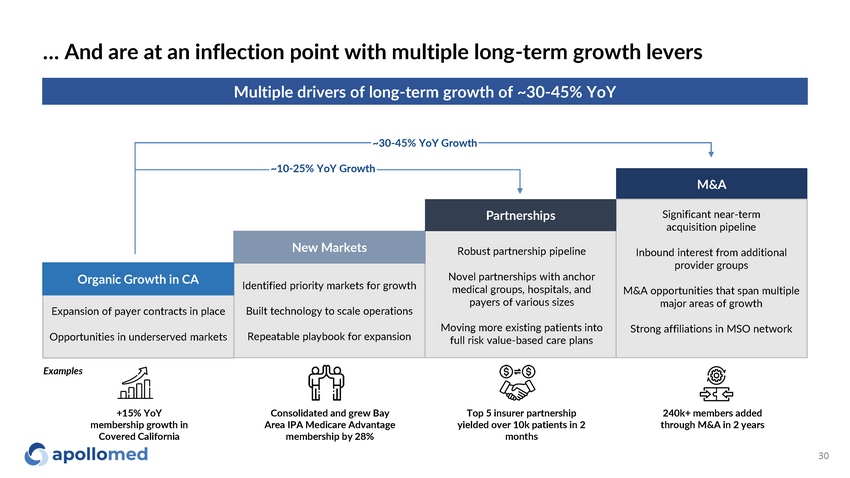
… And are at an inflection point with multiple long - term growth levers Multiple drivers of long - term growth of ~30 - 45% YoY +15% YoY membership growth in Covered California Consolidated and grew Bay Area IPA Medicare Advantage membership by 28% Top 5 insurer partnership yielded over 10k patients in 2 months 240k+ members added through M&A in 2 years M & A Significant near - term acquisition pipeline Inbound interest from additional provider groups M&A opportunities that span multiple major areas of growth Strong affiliations in MSO network Identified priority markets for growth Built technology to scale operations Repeatable playbook for expansion Expansion of payer contracts in place Opportunities in underserved markets Robust partnership pipeline Novel partnerships with anchor medical groups, hospitals, and payers of various sizes Moving more existing patients into full risk value - based care plans New Markets P a r t ne rs h ips Exam p les ~10 - 25% YoY Growth ~30 - 45% YoY Growth Organic Growth in CA 30
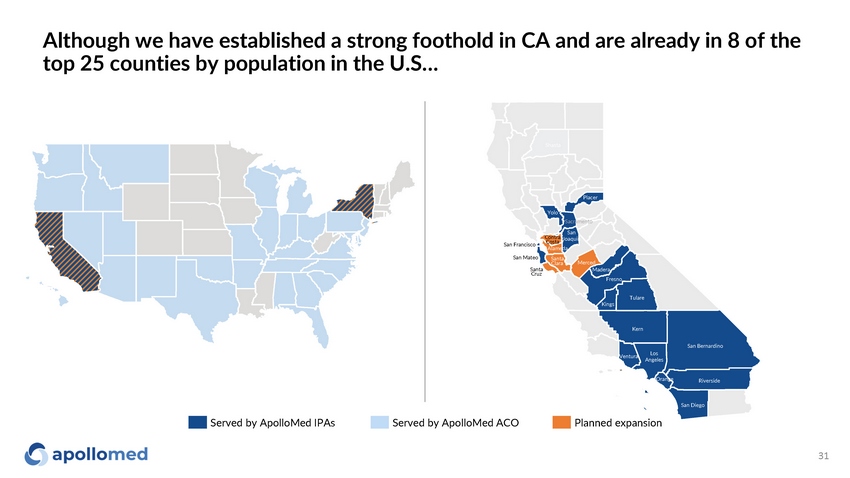
Although we have established a strong foothold in CA and are already in 8 of the top 25 counties by population in the U.S… Served by ApolloMed IPAs Served by ApolloMed ACO Planned expansion San Francisco Pl ace r Yolo Sacramento San Contra Joaquin San Mateo Santa Cruz Santa C l ara Costa A l am e da Merced Madera F re s no Los A ng e l e s Sha sta San Bernardino San Diego T ul are Kings K e r n V e ntu r a R iv er s ide O r ange 31
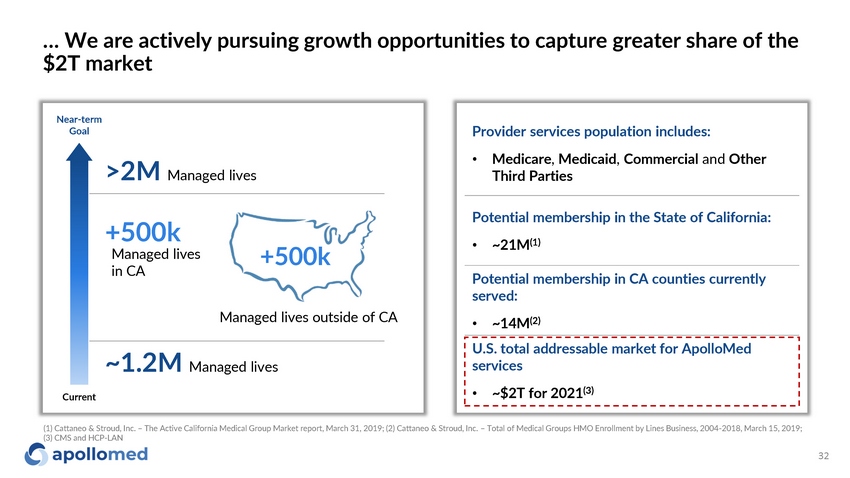
… We are actively pursuing growth opportunities to capture greater share of the $2T market Provider services population includes: • Medicare , Medicaid , Commercial and Other Third Parties Potential membership in the State of California: • ~21M (1) Potential membership in CA counties currently served: • ~14M (2) U.S. total addressable market for ApolloMed services • ~$2T for 2021 (3) Nea r - t e r m Goal Cur r ent ~1.2M Managed lives >2M Managed lives +500k +500k Managed lives in CA Managed lives outside of CA (1) Cattaneo & Stroud, Inc. – The Active California Medical Group Market report, March 31, 2019; (2) Cattaneo & Stroud, Inc. – Total of Medical Groups HMO Enrollment by Lines Business, 2004 - 2018, March 15, 2019; (3) CMS and HCP - LAN 32

Financ i als
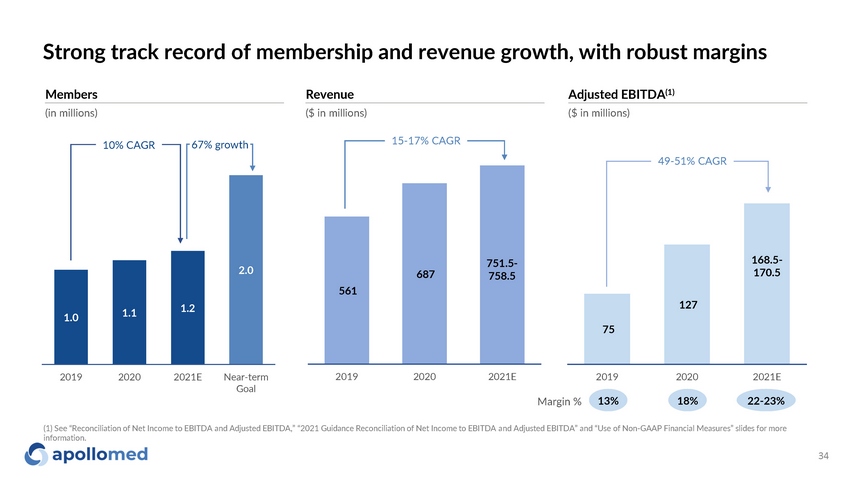
75 127 20 1 9 20 2 0 20 2 1 E 1.0 1.1 1.2 2.0 20 1 9 20 2 0 20 2 1 E N e ar - te r m Goal Strong track record of membership and revenue growth, with robust margins 561 687 2 0 1 9 20 2 0 20 2 1 E 15 - 17% CAGR 10% CAGR 67% growth Members Revenue Adjusted EBITDA (1) (in millions) ($ in millions) ($ in millions) 49 - 51% CAGR Margin % 13% 18% 22 - 23% (1) See “Reconciliation of Net Income to EBITDA and Adjusted EBITDA,” “2021 Guidance Reconciliation of Net Income to EBITDA and Adjusted EBITDA” and “Use of Non - GAAP Financial Measures” slides for more information. 34 751.5 - 758.5 168.5 - 170.5
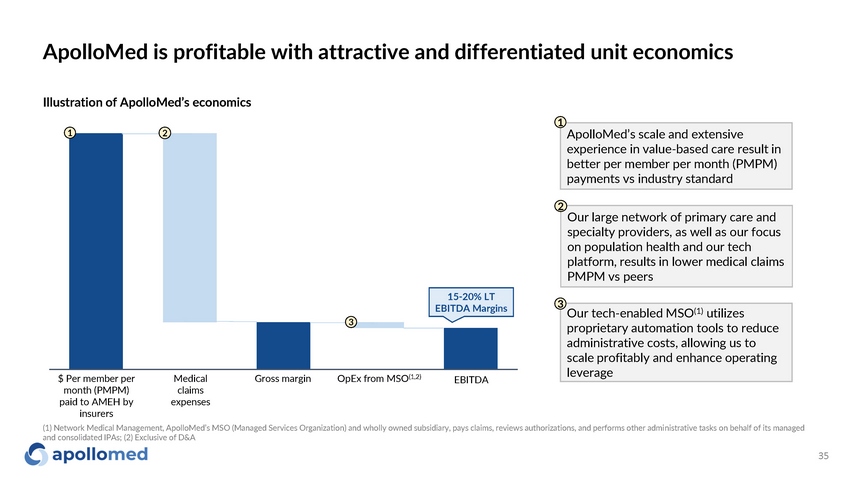
ApolloMed is profitable with attractive and differentiated unit economics 1 2 1 ApolloMed’s scale and extensive experience in value - based care result in better per member per month (PMPM) payments vs industry standard 2 Our large network of primary care and specialty providers, as well as our focus on population health and our tech platform, results in lower medical claims PMPM vs peers Our tech - enabled MSO (1) utilizes proprietary automation tools to reduce administrative costs, allowing us to scale profitably and enhance operating leverage 3 $ Per member per month (PMPM) paid to AMEH by insurers Medical claims e x p e n s e s Gross margin OpEx from MSO (1,2) E B ITDA Illustration of ApolloMed’s economics 15 - 20% LT EBITDA Margins 35 3 (1) Network Medical Management, ApolloMed’s MSO (Managed Services Organization) and wholly owned subsidiary, pays claims, reviews authorizations, and performs other administrative tasks on behalf of its managed and consolidated IPAs; (2) Exclusive of D&A
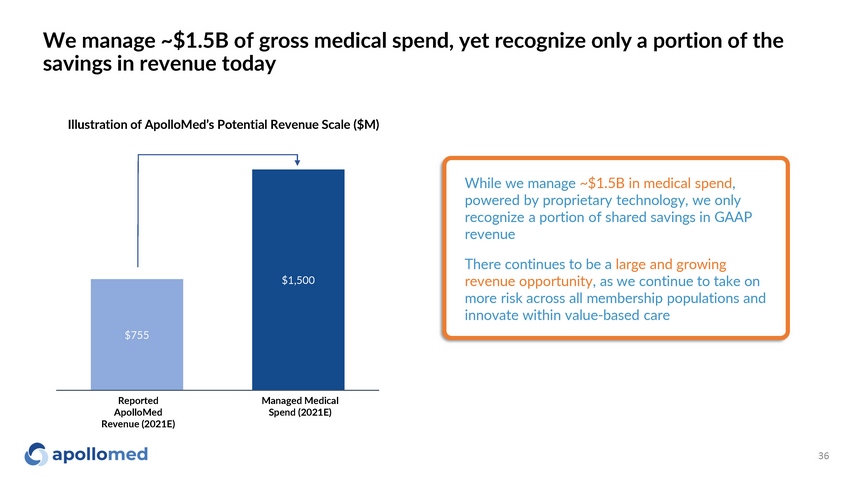
$755 $1, 500 We manage ~$1.5B of gross medical spend, yet recognize only a portion of the savings in revenue today Illustration of ApolloMed’s Potential Revenue Scale ($M) While we manage ~$1.5B in medical spend , powered by proprietary technology, we only recognize a portion of shared savings in GAAP revenue There continues to be a large and growing revenue opportunity , as we continue to take on more risk across all membership populations and innovate within value - based care Reported ApolloMed Revenue (2021E) Managed Medical Spend (2021E) 36
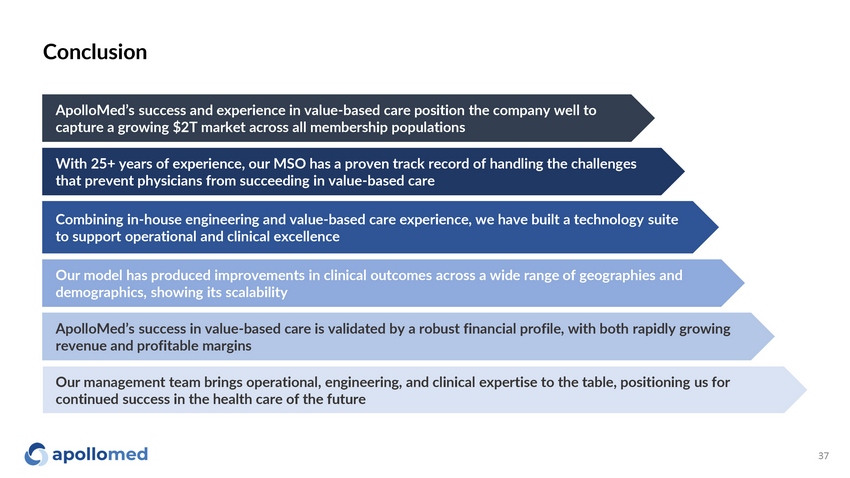
Conclusion ApolloMed’s success and experience in value - based care position the company well to capture a growing $2T market across all membership populations With 25+ years of experience, our MSO has a proven track record of handling the challenges that prevent physicians from succeeding in value - based care Combining in - house engineering and value - based care experience, we have built a technology suite to support operational and clinical excellence Our model has produced improvements in clinical outcomes across a wide range of geographies and demographics, showing its scalability ApolloMed’s success in value - based care is validated by a robust financial profile, with both rapidly growing revenue and profitable margins Our management team brings operational, engineering, and clinical expertise to the table, positioning us for continued success in the health care of the future 37

Appendix
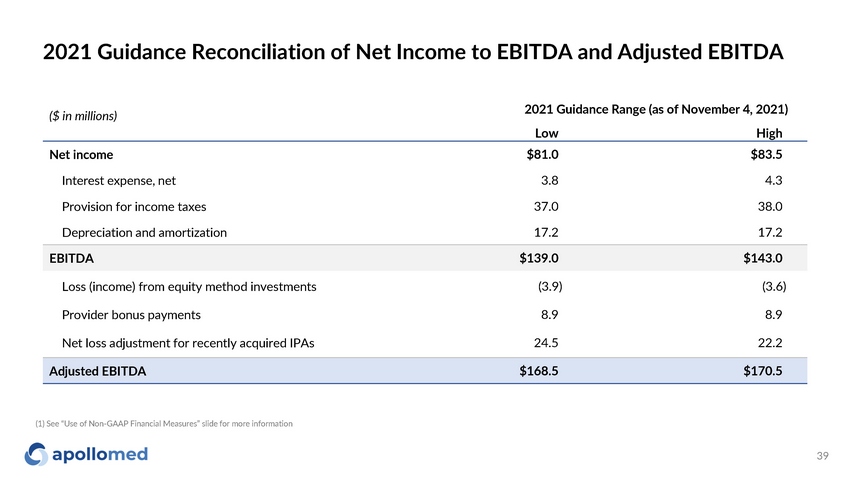
2021 Guidance Reconciliation of Net Income to EBITDA and Adjusted EBITDA 39 (1) See “Use of Non - GAAP Financial Measures” slide for more information ($ in millions) 2021 Guidance Range (a s of November 4, 2021) Low Hi g h Net income $81.0 $83.5 Interest expense, net 3.8 4 . 3 Provision for income taxes 37.0 38.0 Depreciation and amortization 17.2 17.2 EBITDA $139.0 $143.0 Loss (income) from equity method investments (3.9) (3.6) Provider bonus payments 8.9 8 . 9 Net loss adjustment for recently acquired IPAs 24.5 22.2 Adjusted EBITDA $168.5 $170.5
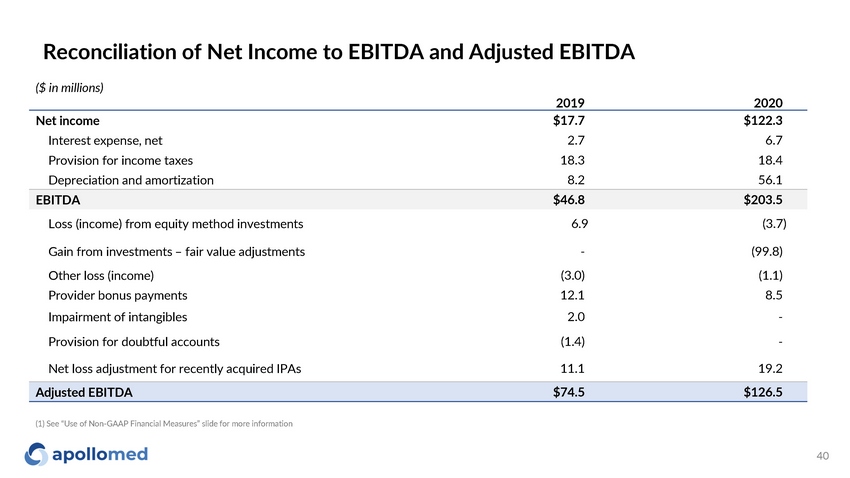
Reconciliation of Net Income to EBITDA and Adjusted EBITDA 40 ($ in millions) 2019 2020 Net income $17.7 $122.3 Interest expense, net 2.7 6.7 Provision for income taxes 18 . 3 18 . 4 Depreciation and amortization 8 . 2 56 . 1 EBITDA $46.8 $203.5 Loss (income) from equity method investments 6 . 9 (3.7) Gain from investments – fair value adjustments - (99.8) Other loss (income) (3.0) (1.1) Provider bonus payments 12 . 1 8 . 5 Impairment of intangibles 2 . 0 - Provision for doubtful accounts (1.4) - Net loss adjustment for recently acquired IPAs 11.1 19.2 Adjusted EBITDA $74.5 $126.5 (1) See “Use of Non - GAAP Financial Measures” slide for more information
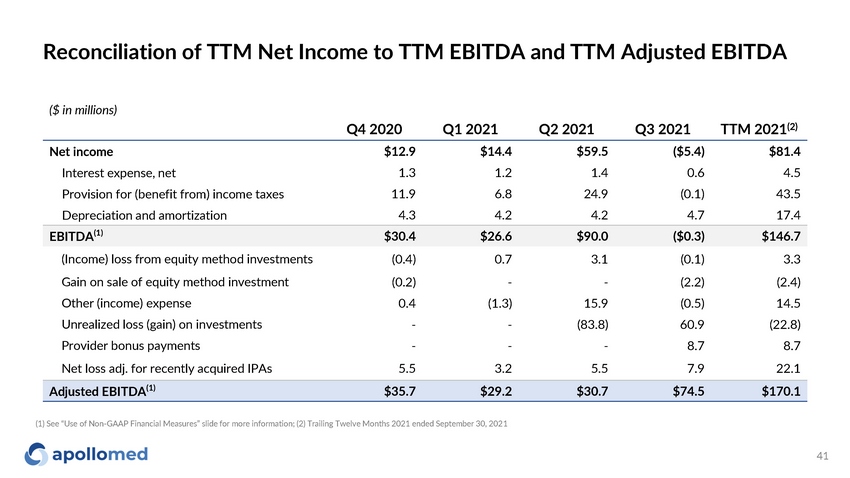
Reconciliation of TTM Net Income to TTM EBITDA and TTM Adjusted EBITDA 41 (1) See “Use of Non - GAAP Financial Measures” slide for more information; (2) Trailing Twelve Months 2021 ended September 30, 2021 ($ in millions) Q4 2020 Q1 2021 Q2 2021 Q3 2021 TTM 2021 (2) Net income $12.9 $14.4 $59.5 ($5.4) $81.4 Interest expense, net 1 . 3 1 . 2 1 . 4 0 . 6 4 . 5 Provision for (benefit from) income taxes 11 . 9 6 . 8 24 . 9 (0.1) 43.5 Depreciation and amortization 4 . 3 4 . 2 4 . 2 4 . 7 17.4 EBITDA (1) $30.4 $26.6 $90.0 ($0.3) $146.7 (Income) loss from equity method investments (0.4) 0 . 7 3 . 1 (0.1) 3 . 3 Gain on sale of equity method investment (0.2) - - (2.2) (2.4) Other (income) expense 0 . 4 (1.3) 15 . 9 (0.5) 14.5 Unrealized loss (gain) on investments - - (83.8) 60 . 9 (22.8) Provider bonus payments - - - 8.7 8.7 Net loss adj. for recently acquired IPAs 5 . 5 3 . 2 5 . 5 7 . 9 22.1 Adjusted EBITDA (1) $35.7 $29.2 $30.7 $74.5 $170.1
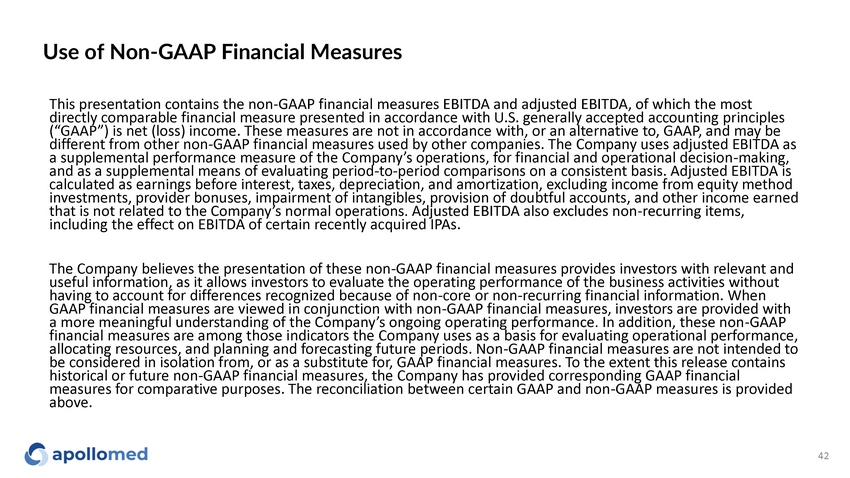
Use of Non - GAAP Financial Measures 42 This presentation contains the non - GAAP financial measures EBITDA and adjusted EBITDA, of which the most directly comparable financial measure presented in accordance with U.S. generally accepted accounting principles (“GAAP”) is net (loss) income. These measures are not in accordance with, or an alternative to, GAAP, and may be different from other non - GAAP financial measures used by other companies. The Company uses adjusted EBITDA as a supplemental performance measure of the Company’s operations, for financial and operational decision - making, and as a supplemental means of evaluating period - to - period comparisons on a consistent basis. Adjusted EBITDA is calculated as earnings before interest, taxes, depreciation, and amortization, excluding income from equity method investments, provider bonuses, impairment of intangibles, provision of doubtful accounts, and other income earned that is not related to the Company’s normal operations. Adjusted EBITDA also excludes non - recurring items, including the effect on EBITDA of certain recently acquired IPAs. The Company believes the presentation of these non - GAAP financial measures provides investors with relevant and useful information, as it allows investors to evaluate the operating performance of the business activities without having to account for differences recognized because of non - core or non - recurring financial information. When GAAP financial measures are viewed in conjunction with non - GAAP financial measures, investors are provided with a more meaningful understanding of the Company’s ongoing operating performance. In addition, these non - GAAP financial measures are among those indicators the Company uses as a basis for evaluating operational performance, allocating resources, and planning and forecasting future periods. Non - GAAP financial measures are not intended to be considered in isolation from, or as a substitute for, GAAP financial measures. To the extent this release contains historical or future non - GAAP financial measures, the Company has provided corresponding GAAP financial measures for comparative purposes. The reconciliation between certain GAAP and non - GAAP measures is provided above.

For inquiries, please contact: ApolloMed Investor Relations (626) 943 - 6491 investors@apollomed.net Carolyne Sohn, The Equity Group (415) 568 - 2255 csohn@equityny.com