EXHIBIT 99.1
Published on November 4, 2022
Exhibit 99.1

1 Apollo Medical Holdings (NASDAQ: AMEH) Powered by Technology. Built by Doctors. For Patients. Third Quarter 2022 Earnings Call Supplement November 4, 2022

Forward - Looking Statements This presentation contains forward - looking statements within the meaning of the Private Securities Litigation Reform Act of 1995, Section 27A of the Securities Act and Section 21E of the Exchange Act. Forward - looking statements include any statements about the Company's business, financial condition, operating results, plans, objectives, expectations and intentions, expansion plans, integration of acquired companies and any projections of earnings, revenue, EBITDA, Adjusted EBITDA or other financial items, such as the Company's projected capitation and future liquidity, and may be identified by the use of forward - looking terms such as “anticipate,” “could,” “can,” “may,” “might,” “potential,” “predict,” “should,” “estimate,” “expect,” “project,” “believe,” “plan,” “envision,” “intend,” “continue,” “target,” “seek,” “will,” “would,” and the negative of such terms, other variations on such terms or other similar or comparable words, phrases or terminology. Forward - looking statements reflect current views with respect to future events and financial performance and therefore cannot be guaranteed. Such statements are based on the current expectations and certain assumptions of the Company's management, and some or all of such expectations and assumptions may not materialize or may vary significantly from actual results. Actual results may also vary materially from forward - looking statements due to risks, uncertainties and other factors, known and unknown, including the risk factors described from time to time in the Company’s reports to the U.S. Securities and Exchange Commission (the “SEC”), including without limitation the risk factors discussed in the Company's Annual Report on Form 10 - K for the year ended December 31, 2021, and subsequent Quarterly Reports on Form 10 - Q. Because the factors referred to above could cause actual results or outcomes to differ materially from those expressed or implied in any forward - looking statements, you should not place undue reliance on any such forward - looking statements. Any forward - looking statements speak only as of the date of this presentation and, unless legally required, the Company does not undertake any obligation to update any forward - looking statement, as a result of new information, future events or otherwise. 2 www.apollomed.net
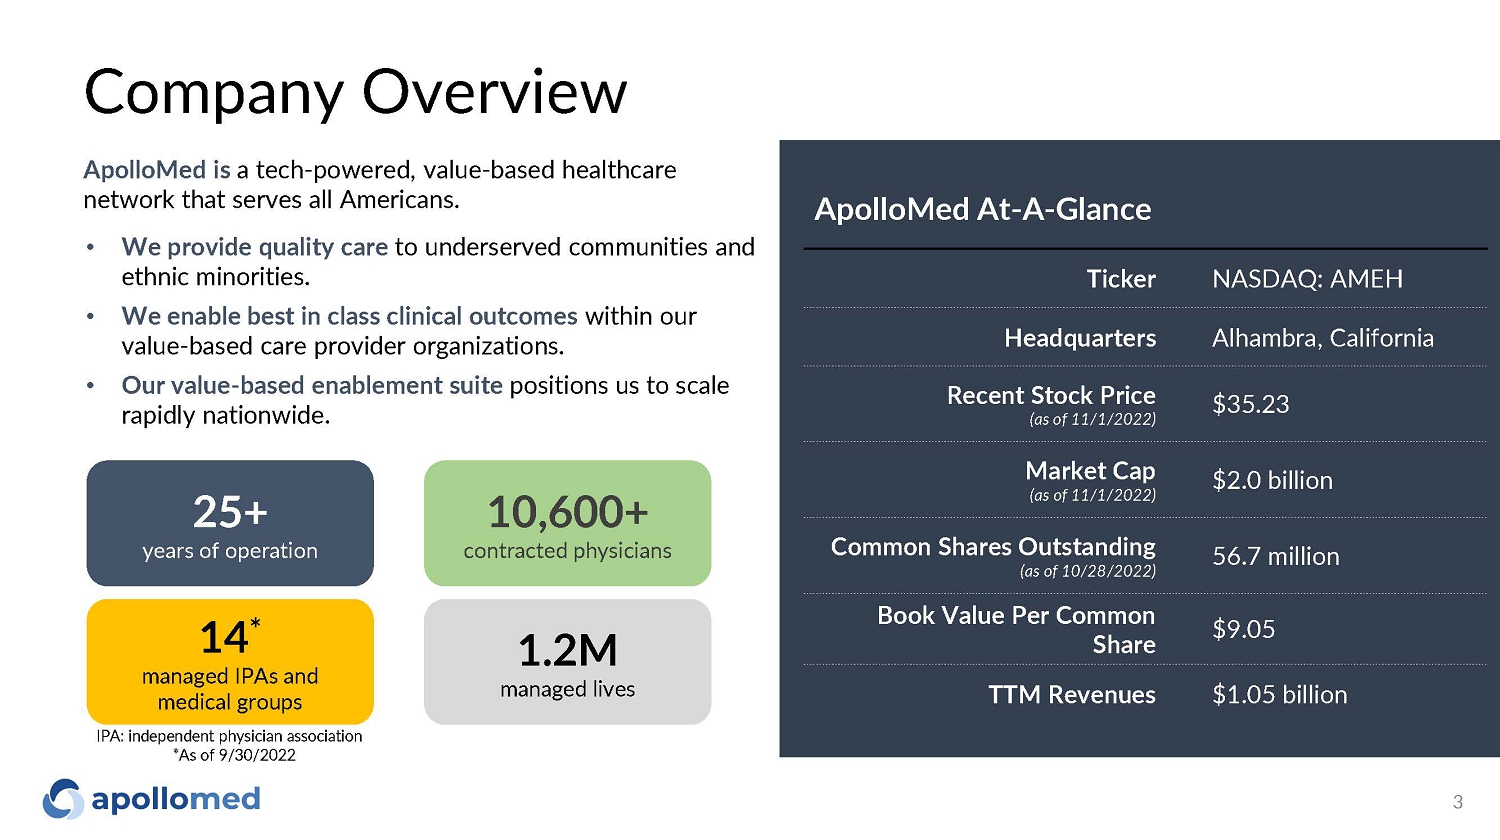
14 * managed IPAs and medical groups IPA: independent physician association *As of 9/30/2022 1.2M managed lives Company Overview 3 10,600+ contracted physicians 25+ years of operation ApolloMed is a tech - powered, value - based healthcare network that serves all Americans. • We provide quality care to underserved communities and ethnic minorities. • We enable best in class clinical outcomes within our value - based care provider organizations. • Our value - based enablement suite positions us to scale rapidly nationwide. ApolloMed At - A - Glance Ticker NASDAQ: AMEH He a d q u a rters Alhambra, California Recent Stock Price (as of 11/1/2022) $35.23 Market Cap (as of 11/1/2022) $2.0 billion Common Shares Outstanding (as of 10/28/2022) 56.7 million Book Value Per Common Share $9.05 TTM Revenues $1.05 billion
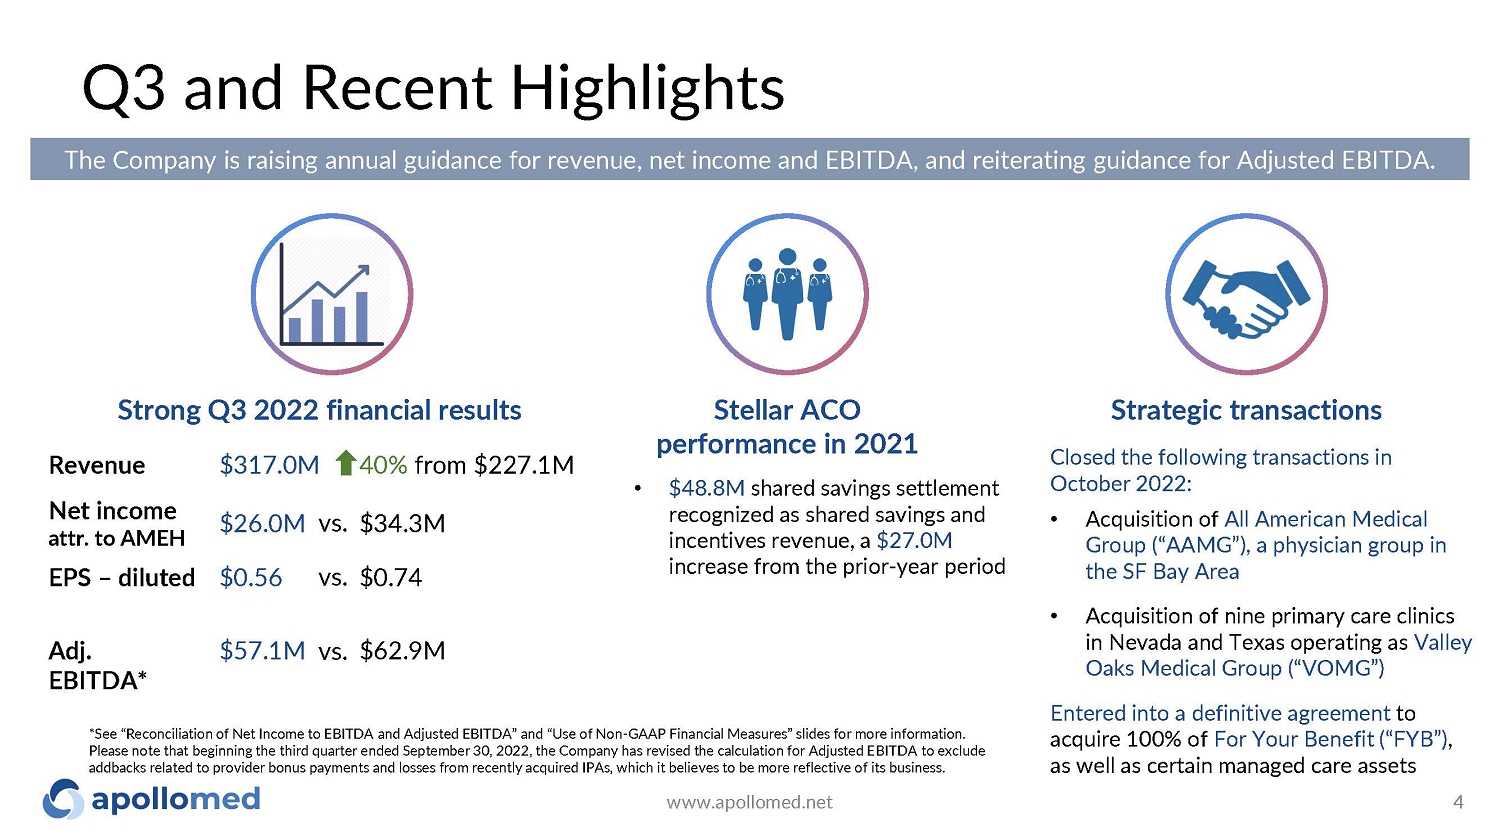
Strong Q3 2022 financial results Q3 and Recent Highlights Strategic transactions Closed the following transactions in October 2022: • Acquisition of All American Medical Group (“AAMG”), a physician group in the SF Bay Area • Acquisition of nine primary care clinics in Nevada and Texas operating as Valley Oaks Medical Group (“VOMG”) Entered into a definitive agreement to acquire 100% of For Your Benefit (“FYB”) , as well as certain managed care assets *See “Reconciliation of Net Income to EBITDA and Adjusted EBITDA” and “Use of Non - GAAP Financial Measures” slides for more information. Please note that beginning the third quarter ended September 30, 2022, the Company has revised the calculation for Adjusted EBITDA to exclude addbacks related to provider bonus payments and losses from recently acquired IPAs, which it believes to be more reflective of its business. Revenue $317.0M 40% from $227.1M Net income attr. to AMEH $26.0M vs. $34.3M EPS – diluted $0 . 56 vs . $0.74 Adj. E BITD A * $57.1M vs. $62.9M Stellar ACO performance in 2021 • $48.8M shared savings settlement recognized as shared savings and incentives revenue, a $27.0M increase from the prior - year period The Company is raising annual guidance for revenue, net income and EBITDA, and reiterating guidance for Adjusted EBITDA. www.apollomed.net 4
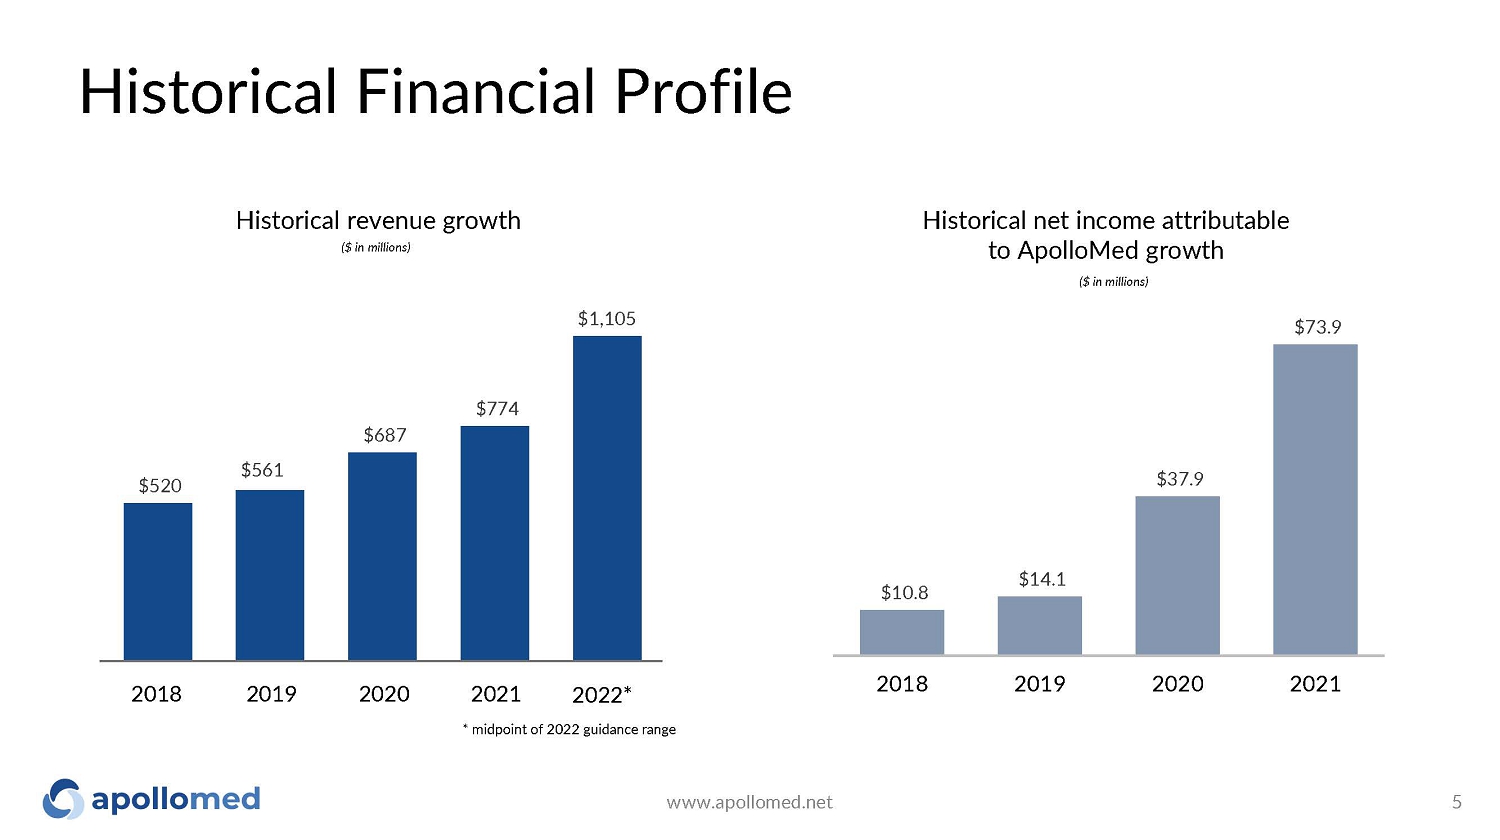
Historical Financial Profile $10. 8 $14. 1 $37. 9 $73. 9 2018 2019 2020 2021 $520 $561 $774 $687 $1, 105 Historical revenue growth ($ in millions) www.apollomed.net 5 Historical net income attributable to ApolloMed growth ($ in millions) 2021 2022* * midpoint of 2022 guidance range 2018 2019 2020
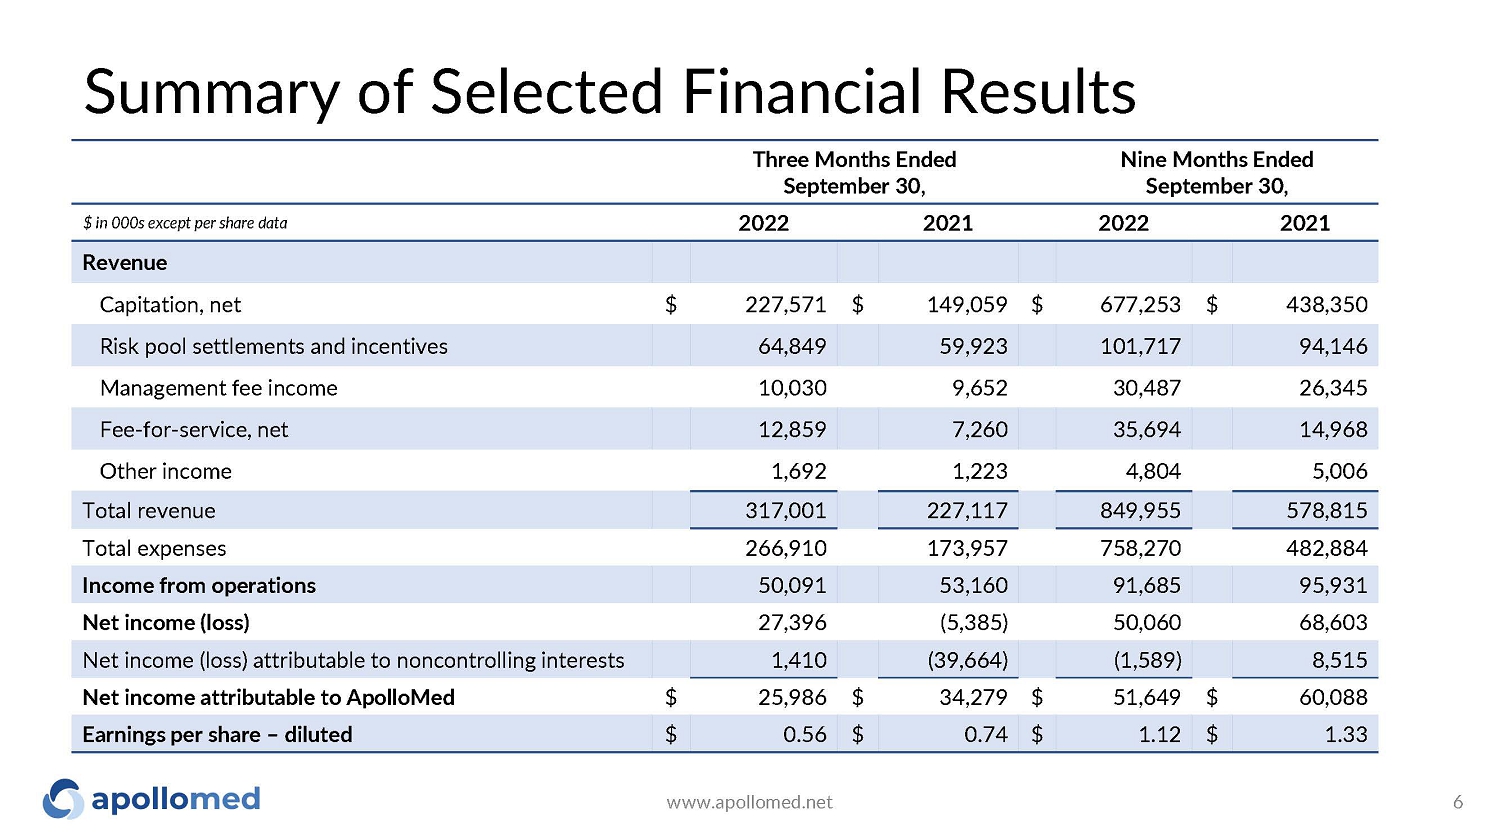
Summary of Selected Financial Results www.apollomed.net 6 Three Months Ended September 30, Nine Months Ended September 30, $ in 000s except per share data 2022 2021 2022 2021 Revenue Capitation, net $ 227,571 $ 149,059 $ 677,253 $ 438,350 Risk pool settlements and incentives 64 , 849 59 , 923 101,717 94 , 146 Management fee income 10 , 030 9 , 652 30 , 487 26 , 345 Fee - for - service, net 12 , 859 7 , 260 35 , 694 14 , 968 Other income 1 , 692 1 , 223 4 , 804 5 , 006 Total revenue 317,001 227,117 849,955 578,815 Total expenses 266,910 173,957 758,270 482,884 Income from operations 50 , 091 53 , 160 91 , 685 95 , 931 Net income (loss) 27,396 (5,385) 50,060 68,603 Net income (loss) attributable to noncontrolling interests 1 , 410 (39,664) (1,589) 8 , 515 Net income attributable to ApolloMed $ 25 , 986 $ 34 , 279 $ 51 , 649 $ 60 , 088 Earnings per share – diluted $ 0 . 56 $ 0 . 74 $ 1 . 12 $ 1.33
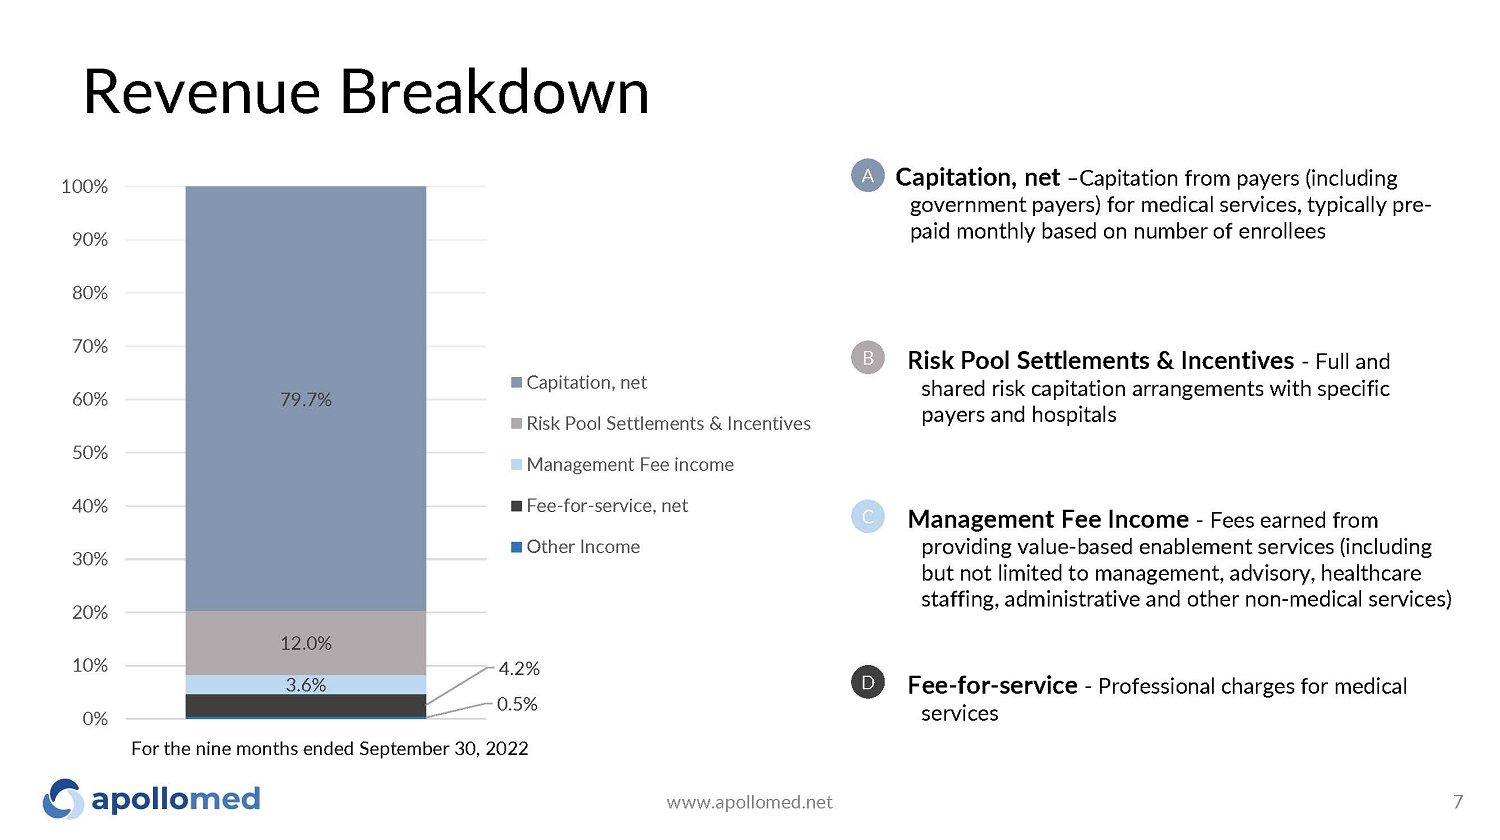
Capitation, net – Capitation from payers (including government payers) for medical services, typically pre - paid monthly based on number of enrollees 79.7% 12.0% 3.6% 4. 2 % 0.5% 0% 10% 20% 30% 40% 50% 60% 70% 80% 90% 100% Capitation, net Risk Pool Settlements & Incentives Management Fee income Fee - for - service, net Other Income Revenue Breakdown A B C D www.apollomed.net 7 For the nine months ended September 30, 2022 Risk Pool Settlements & Incentives - Full and shared risk capitation arrangements with specific payers and hospitals Management Fee Income - Fees earned from providing value - based enablement services (including but not limited to management, advisory, healthcare staffing, administrative and other non - medical services) Fee - for - service - Professional charges for medical services
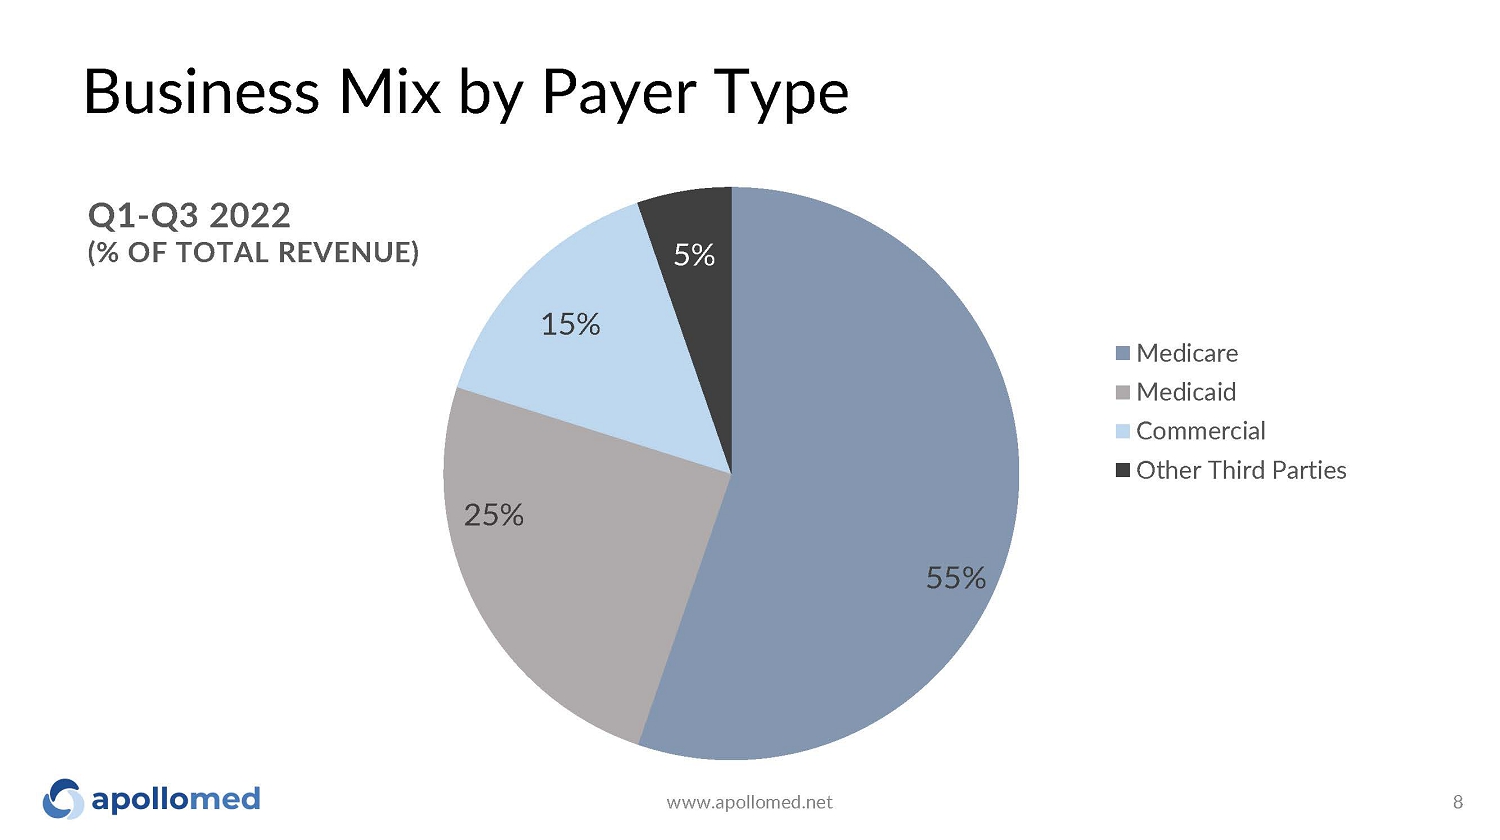
55% 25% 15% 5% Q1 - Q3 2022 (% OF TOTAL REVENUE) Medicare Medicaid Co m m er c ial Other Third Parties Business Mix by Payer Type www.apollomed.net 8
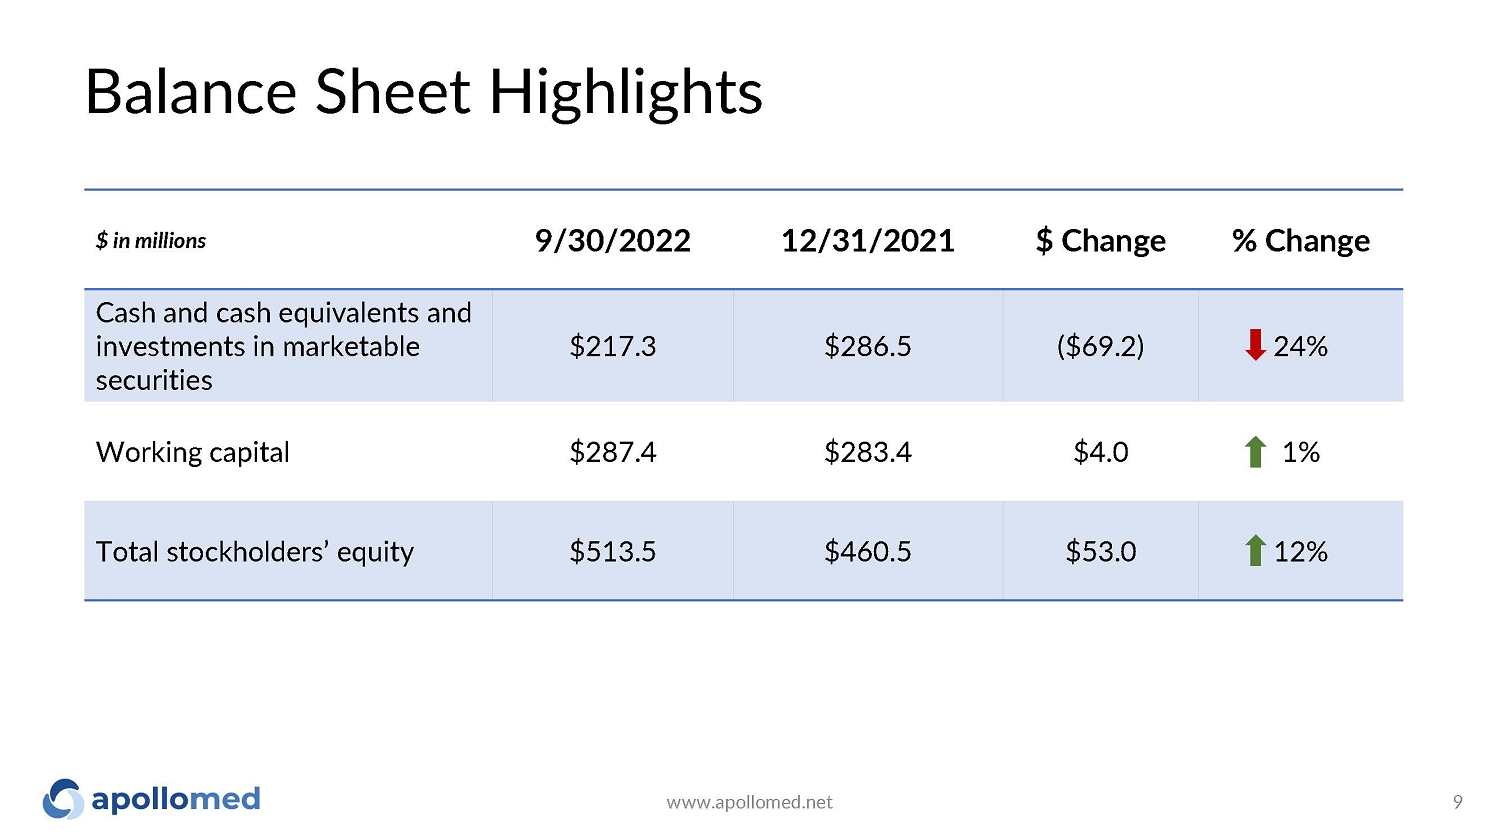
Balance Sheet Highlights $ in millions 9/30/2022 12/31/2021 $ Change % Change Cash and cash equivalents and investments in marketable securities $217.3 $286.5 ($69.2) 24% Working capital $287.4 $283.4 $4.0 1% Total stockholders’ equity $513.5 $460.5 $53.0 12% www.apollomed.net 9
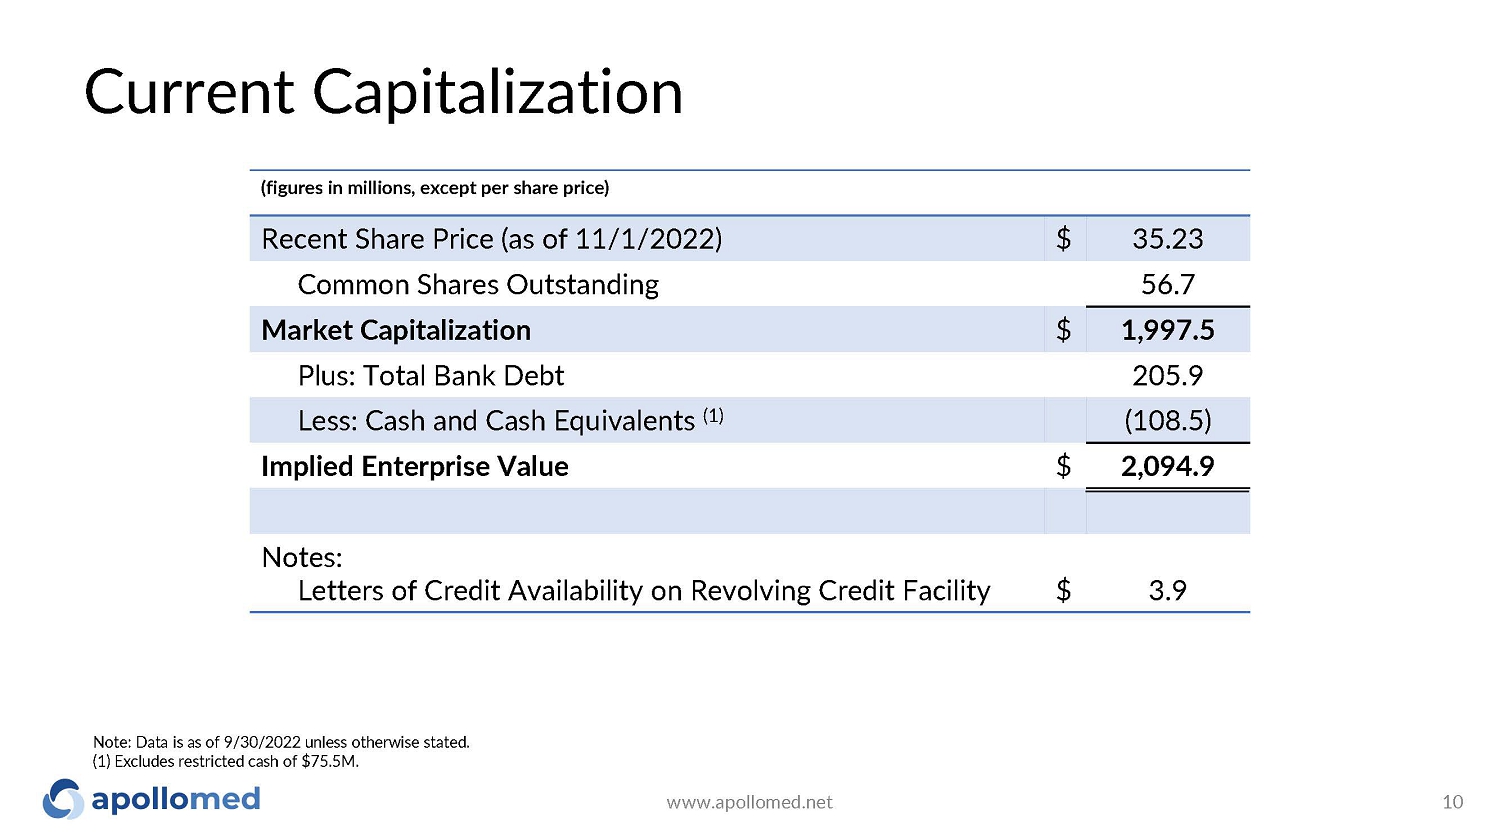
Current Capitalization www.apollomed.net 10 Note: Data is as of 9/30/2022 unless otherwise stated. (1) Excludes restricted cash of $75.5M. (figures in millions, except per share price) Recent Share Price (as of 11/1/2022) $ 35.23 Common Shares Outstanding 56.7 Market Capitalization $ 1,997.5 Plus: Total Bank Debt 205.9 Less: Cash and Cash Equivalents (1) (108.5) Implied Enterprise Value $ 2,094.9 Notes: Letters of Credit Availability on Revolving Credit Facility $ 3.9
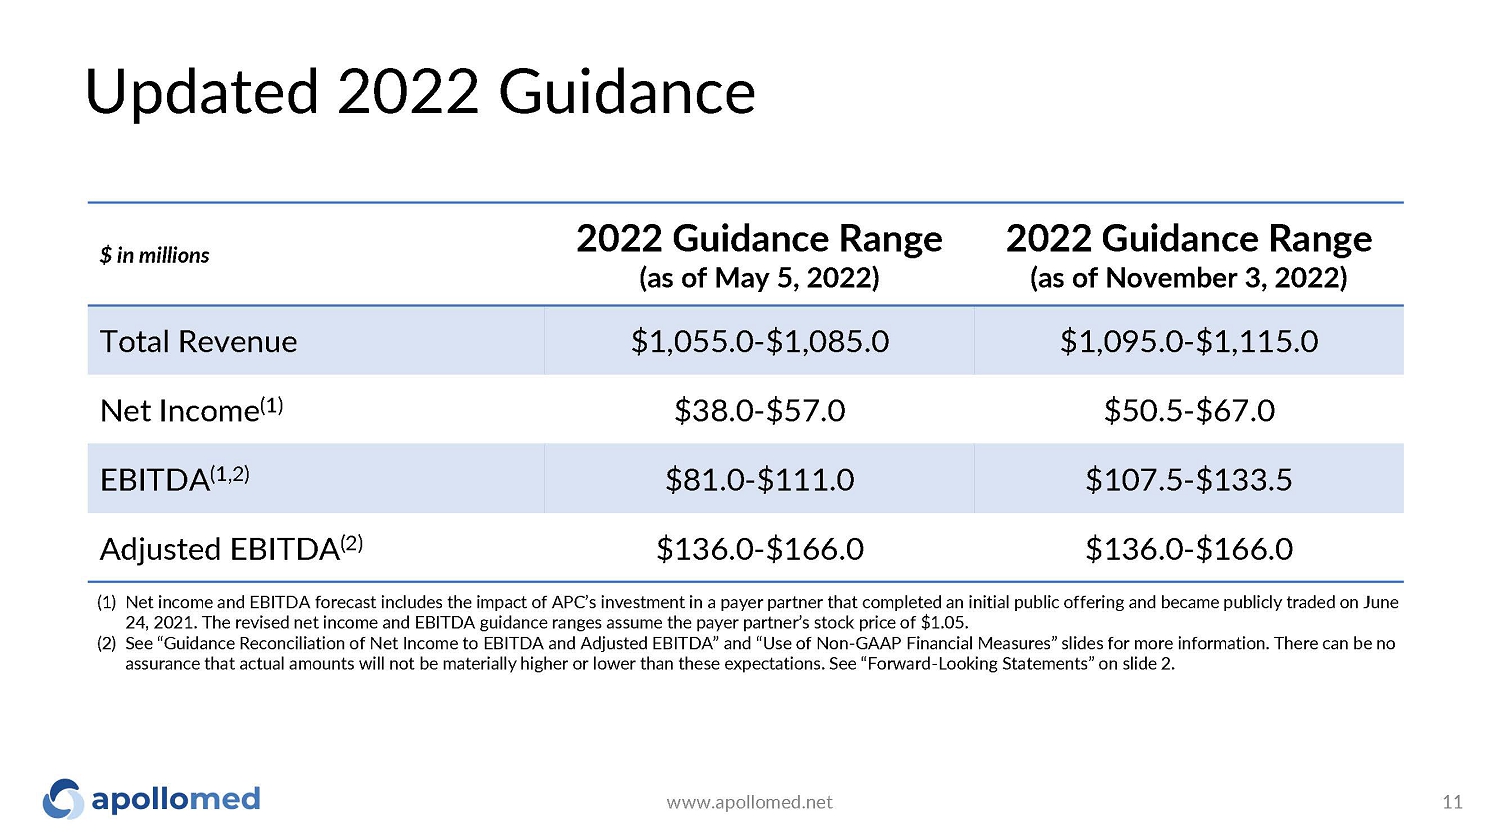
Updated 2022 Guidance www.apollomed.net 11 $ in millions 2022 Guidance Range (as of May 5, 2022) 2022 Guidance Range (as of November 3, 2022) Total Revenue $1,055.0 - $1,085.0 $1,095.0 - $1,115.0 Net Income (1) $38.0 - $57.0 $50.5 - $67.0 EBITDA (1,2) $81.0 - $111.0 $107.5 - $133.5 Adjusted EBITDA (2) $136.0 - $166.0 $136.0 - $166.0 (1) Net income and EBITDA forecast includes the impact of APC’s investment in a payer partner that completed an initial public offering and became publicly traded on June 24, 2021. The revised net income and EBITDA guidance ranges assume the payer partner’s stock price of $1.05. (2) See “Guidance Reconciliation of Net Income to EBITDA and Adjusted EBITDA” and “Use of Non - GAAP Financial Measures” slides for more information. There can be no assurance that actual amounts will not be materially higher or lower than these expectations. See “Forward - Looking Statements” on slide 2.
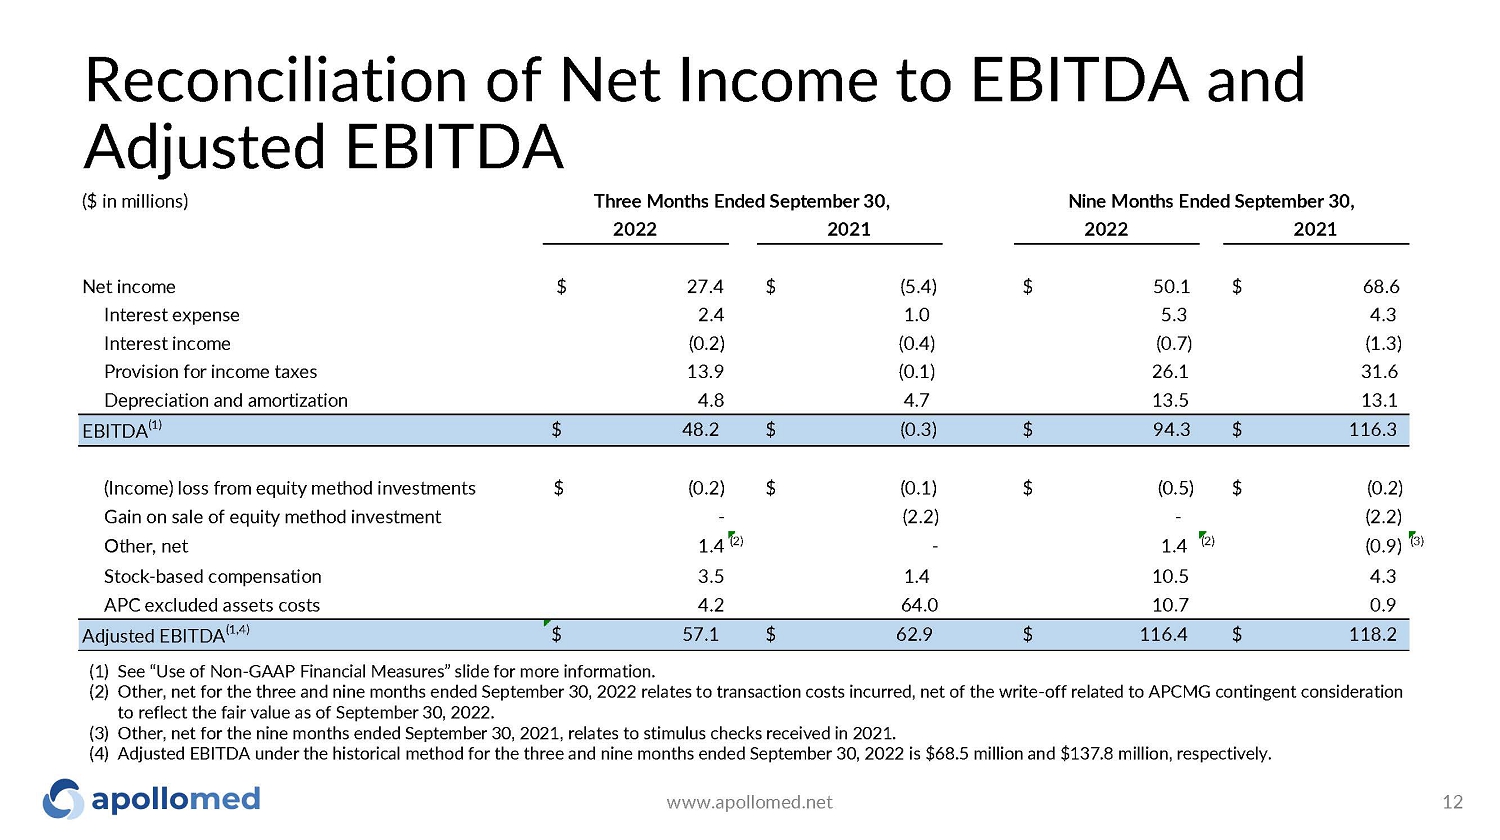
2022 2021 2022 2021 Net income $ 27 . 4 $ ( 5 . 4 ) $ 50.1 $ 68 . 6 Interest expense 2 . 4 1.0 5.3 4.3 Interest income ( 0 . 2 ) ( 0 . 4 ) (0.7) ( 1 . 3 ) Provision for income taxes 13 . 9 ( 0 . 1 ) 26.1 31 . 6 Depreciation and amortization 4 . 8 4.7 13.5 13 . 1 EBITDA (1) $ 48 . 2 $ ( 0 . 3 ) $ 94.3 $ 116 . 3 (Income) loss from equity method investments $ (0.2) $ ( 0 . 1 ) $ (0.5) $ ( 0 . 2 ) Gain on sale of equity method investment - ( 2 . 2 ) - ( 2 . 2 ) Other, net 1.4 (2) - 1.4 (2) ( 0 . 9 ) (3) Stock - based compensation 3 . 5 1 . 4 10 . 5 4 . 3 APC excluded assets costs 4 . 2 64 . 0 10 . 7 0 . 9 Adjusted EBITDA (1,4) $ 57.1 $ 62.9 $ 116.4 $ 118.2 www.apollomed.net 12 Reconciliation of Net Income to EBITDA and Adjusted EBITDA ($ in millions) Three Months Ended September 30, Nine Months Ended September 30, (1) See “Use of Non - GAAP Financial Measures” slide for more information. (2) Other, net for the three and nine months ended September 30, 2022 relates to transaction costs incurred, net of the write - off related to APCMG contingent consideration to reflect the fair value as of September 30, 2022. (3) Other, net for the nine months ended September 30, 2021, relates to stimulus checks received in 2021. (4) Adjusted EBITDA under the historical method for the three and nine months ended September 30, 2022 is $68.5 million and $137.8 million, respectively.
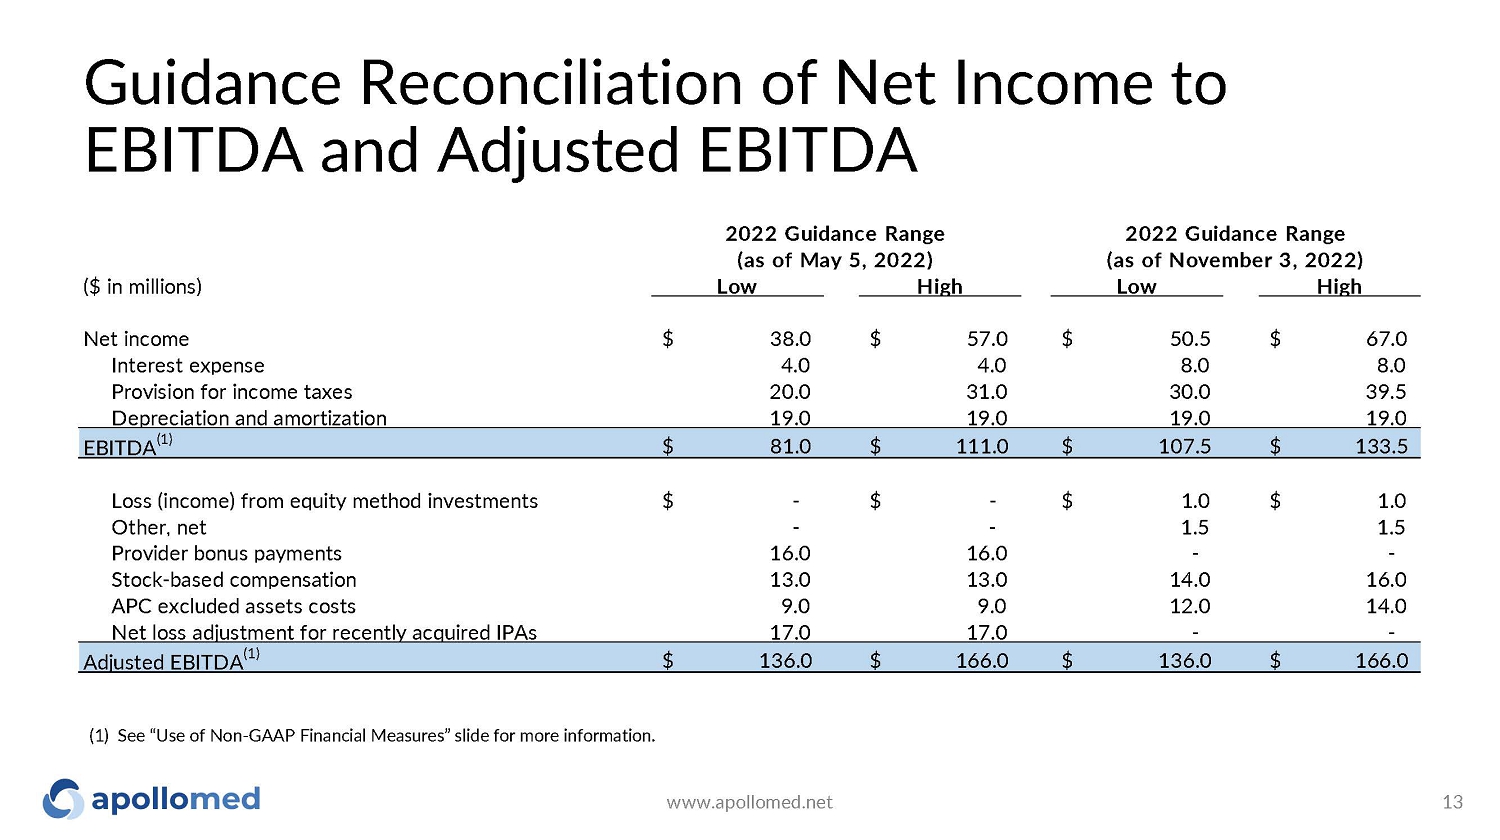
Guidance Reconciliation of Net Income to EBITDA and Adjusted EBITDA www.apollomed.net 13 (1) See “Use of Non - GAAP Financial Measures” slide for more information. ($ in millions) Low High Low High Net income $ 38.0 $ 57.0 $ 50.5 $ 67.0 Interest expense 4 . 0 4 . 0 8 . 0 8 . 0 Provision for income taxes 20 . 0 31.0 30.0 39 . 5 Depreciation and amortization 19 . 0 19.0 19.0 19 . 0 EBITDA (1) $ 81.0 $ 111.0 $ 107.5 $ 133.5 Loss (income) from equity method investments $ - $ - $ 1.0 $ 1.0 Other, net - - 1 . 5 1 . 5 Provider bonus payments 16 . 0 16.0 - - Stock - based compensation 13 . 0 13.0 14.0 16 . 0 APC excluded assets costs 9 . 0 9 . 0 12.0 14 . 0 Net loss adjustment for recently acquired IPAs 17 . 0 17.0 - - Adjusted EBITDA (1) $ 136.0 $ 166.0 $ 136.0 $ 166.0 2022 Guidance Range (as of May 5, 2022) 2022 Guidance Range (as of November 3, 2022)
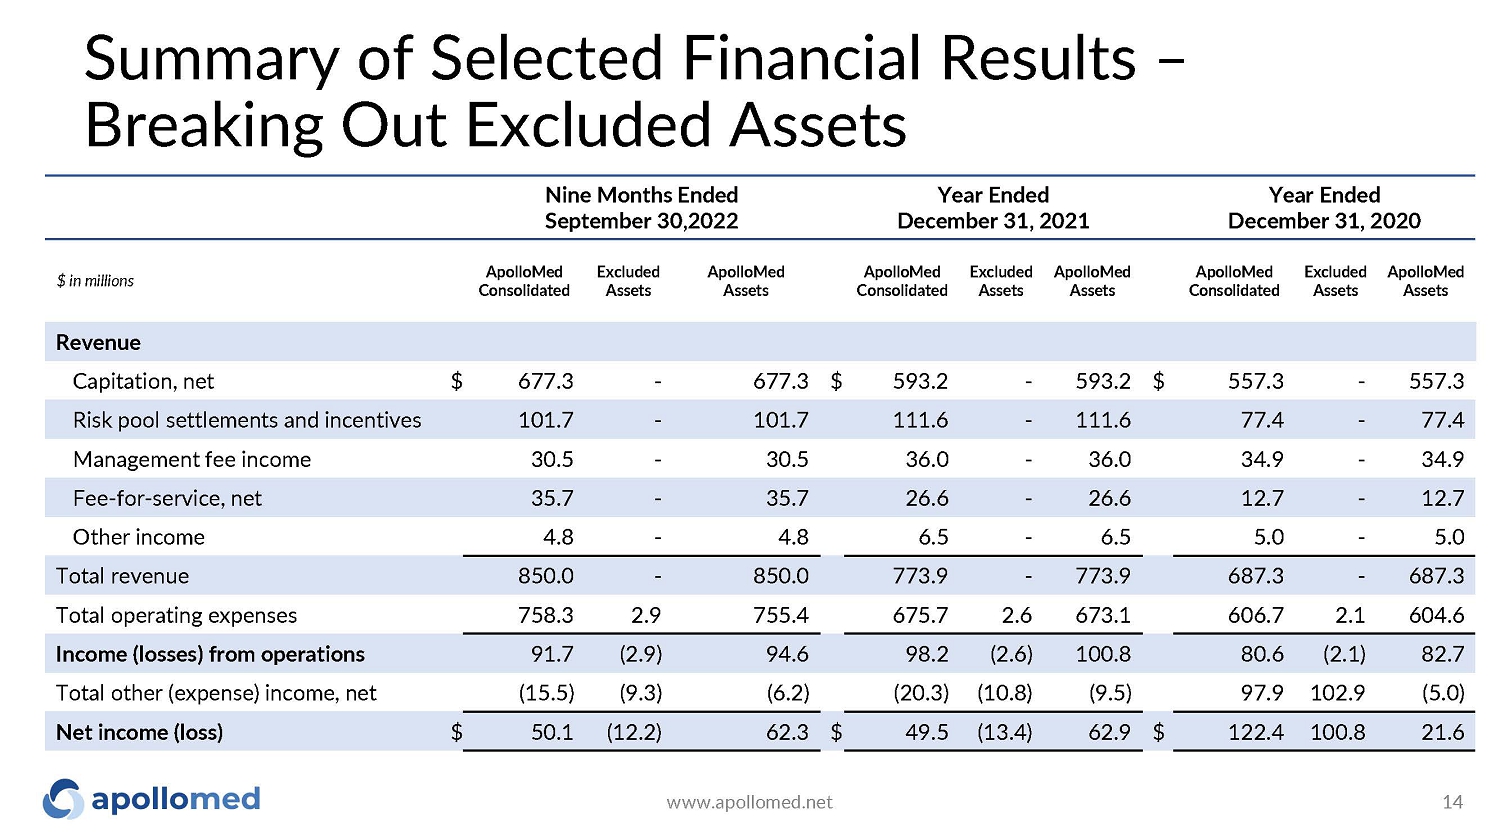
Revenue Capitation, net $ 677.3 - 677.3 $ 593.2 - 593.2 $ 557.3 - 557.3 Risk pool settlements and incentives 101.7 - 101.7 111.6 - 111.6 77 . 4 - 77.4 Management fee income 30.5 - 30 . 5 36.0 - 36 . 0 34.9 - 34.9 Fee - for - service, net 35 . 7 - 35 . 7 26 . 6 - 26 . 6 12 . 7 - 12.7 Other income 4.8 - 4.8 6 . 5 - 6.5 5.0 - 5.0 Total revenue 850.0 - 850.0 773.9 - 773.9 687.3 - 687.3 Total operating expenses 758.3 2 . 9 755.4 675.7 2 . 6 673.1 606.7 2 . 1 604.6 Income (losses) from operations 91 . 7 (2.9) 94 . 6 98 . 2 (2.6) 100.8 80 . 6 (2.1) 82.7 Total other (expense) income, net (15.5) (9.3) (6.2) (20.3) (10.8) (9.5) 97.9 102.9 (5.0) Net income (loss) $ 50.1 (12.2) 62.3 $ 49.5 (13.4) 62.9 $ 122.4 100.8 21.6 Nine Months Ended September 30,2022 www.apollomed.net 14 Year Ended December 31, 2021 Year Ended December 31, 2020 $ in millions ApolloMed Excluded ApolloMed Apo l lo Me d Excluded ApolloMed ApolloMed Excluded ApolloMed Consolidated Assets Assets Con s olid a ted Assets Assets Consolidated Assets Assets Summary of Selected Financial Results – Breaking Out Excluded Assets
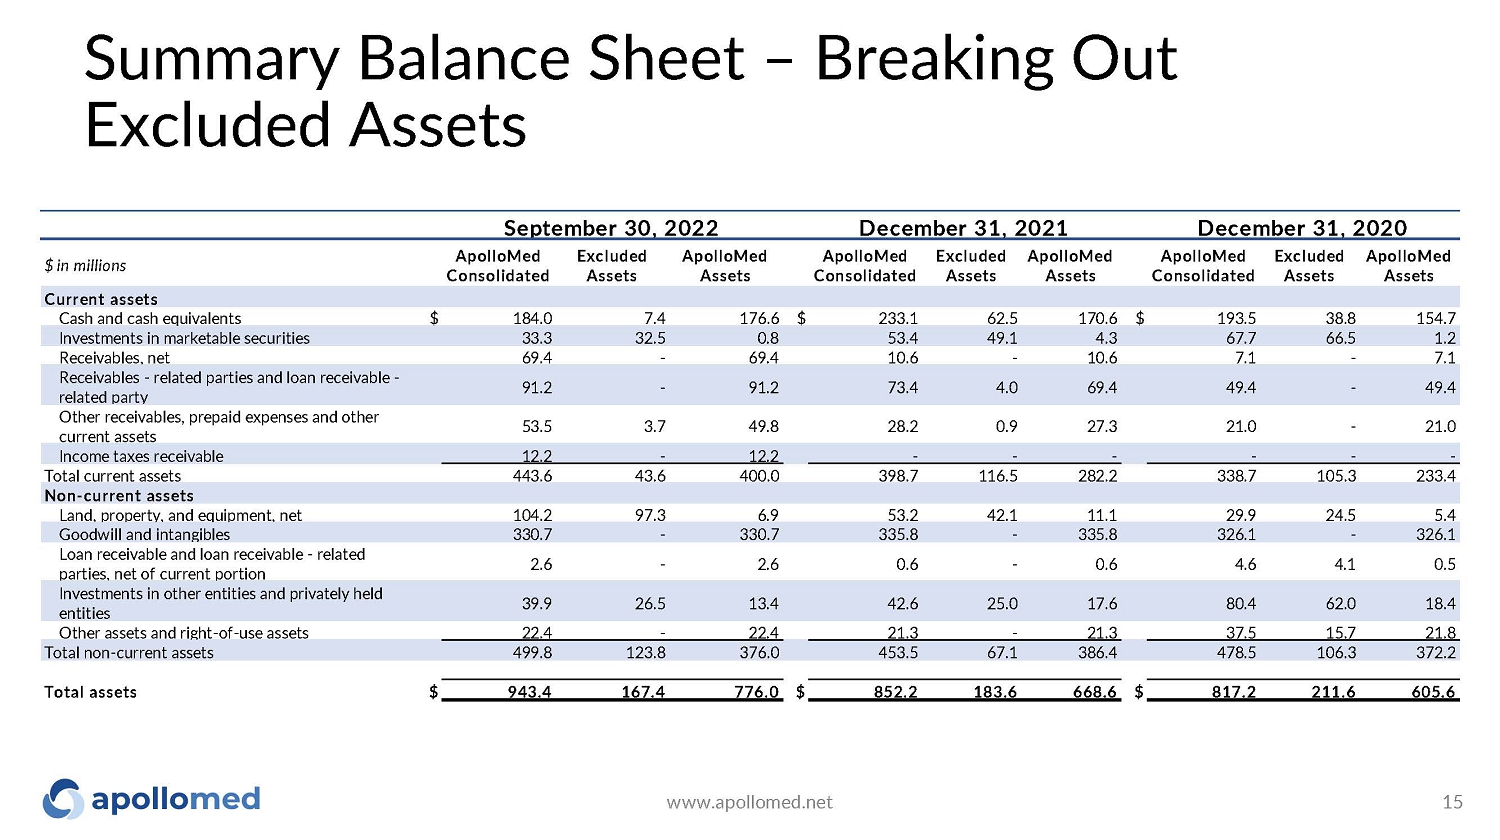
Summary Balance Sheet – Breaking Out Excluded Assets related party current assets parties, net of current portion entities $ in millions ApolloMed C o ns o l id a t e d E x c l ud e d Assets Ap o ll o M e d Assets ApolloMed C o ns o l id a t e d E x c l ud e d Assets Ap o ll o M e d Assets ApolloMed C o ns o l id a t e d E x c l ud e d Assets Ap o ll o M e d Assets Current assets C ash and c ash e qu i v a l e n t s $ 184 . 0 7 . 4 176 . 6 $ 233 . 1 62 . 5 170 . 6 $ 193 . 5 38 . 8 154 . 7 I n v e s t m e n t s i n m a r k e t ab l e s e c u r i t i e s 33 . 3 32 . 5 0 . 8 53 . 4 49 . 1 4 . 3 67 . 7 66 . 5 1 . 2 R e c e i v ab l e s, n e t 69 . 4 - 69 . 4 10 . 6 - 10 . 6 7 . 1 - 7 . 1 R e c e i v ab l e s - r e l a t e d pa rt i e s and l o an r e c e i v ab l e - 91 . 2 - 91 . 2 73 . 4 4 . 0 69 . 4 49 . 4 - 49 . 4 O t h e r r e c e i v ab l e s, p r e pa i d e xp e n s e s and o t h e r 53 . 5 3 . 7 49 . 8 28 . 2 0 . 9 27 . 3 21 . 0 - 21 . 0 I n c o m e t ax e s r e c e i v ab l e 12 . 2 - 12 . 2 - - - - - - Total current assets 443.6 Non - current assets 43 . 6 400 . 0 398 . 7 116 . 5 282 . 2 338 . 7 105 . 3 233 . 4 L and, p r o p e r t y , and e qu i p m e n t , n e t 104 . 2 97 . 3 6 . 9 53 . 2 42 . 1 11 . 1 29 . 9 24 . 5 5 . 4 G oo d w i l l and i n t an g i b l e s 330 . 7 - 330 . 7 335 . 8 - 335 . 8 326 . 1 - 326 . 1 L o an r e c e i v ab l e and l o an r e c e i v ab l e - r e l a t e d 2 . 6 - 2 . 6 0 . 6 - 0 . 6 4 . 6 4 . 1 0 . 5 I n v e s t m e n t s i n o t h e r e n t i t i e s and p ri v a t e l y h e l d 39 . 9 26 . 5 13 . 4 42 . 6 25 . 0 17 . 6 80 . 4 62 . 0 18 . 4 O t h e r ass e t s and ri g h t - o f - use ass e t s 22 . 4 - 22 . 4 21 . 3 - 21 . 3 37 . 5 15 . 7 21 . 8 Total non - current assets 499.8 123 . 8 376 . 0 453 . 5 67 . 1 386 . 4 478 . 5 106 . 3 372 . 2 Total assets $ 943.4 167 . 4 776 . 0 $ 852 . 2 183 . 6 668 . 6 $ 817 . 2 211 . 6 605 . 6 September 30, 2022 December 31, 2021 December 31, 2020 www.apollomed.net 15
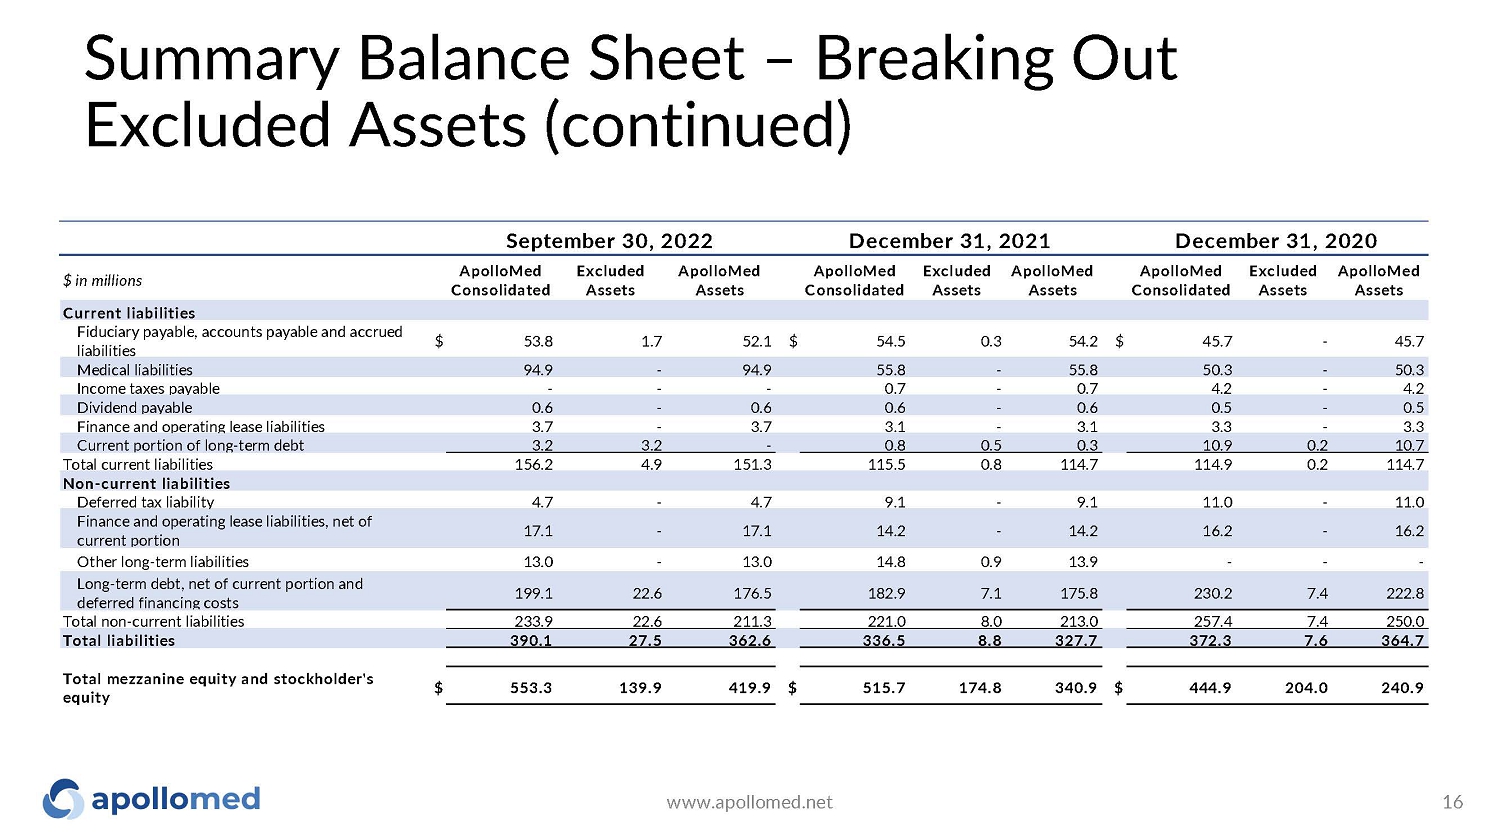
Summary Balance Sheet – Breaking Out Excluded Assets (continued) li ab i li t i e s current portion deferred financing costs equity $ in millions ApolloMed C o ns o l i da t e d E x c l u d e d Assets Ap o ll oM e d Assets ApolloMed C o ns o l i da t e d E x c l u d e d Assets Ap o ll oM e d Assets ApolloMed C o ns o l i da t e d E x c l u d e d Assets Ap o ll oM e d Assets Current liabilities F i du c i a r y pa y ab l e , a c c o un t s pa y ab l e and a c c r u e d $ 53 . 8 1 . 7 52 . 1 $ 54 . 5 0 . 3 54 . 2 $ 45 . 7 - 45 . 7 M e d i c al l i ab i l i t i e s 94 . 9 - 94 . 9 55 . 8 - 55 . 8 50 . 3 - 50 . 3 I n c o m e t ax e s pa y ab l e - - - 0 . 7 - 0 . 7 4 . 2 - 4 . 2 D i v i d e nd pa y ab l e 0 . 6 - 0 . 6 0 . 6 - 0 . 6 0 . 5 - 0 . 5 F i nan c e and o p e r a t i ng l e ase l i ab i l i t i e s 3 . 7 - 3 . 7 3 . 1 - 3 . 1 3 . 3 - 3 . 3 C u r r e nt p o r t i o n o f l o n g - t e r m d e bt 3 . 2 3 . 2 - 0 . 8 0 . 5 0 . 3 10 . 9 0 . 2 10 . 7 Total current liabilities 156.2 Non - current liabilities 4 . 9 151 . 3 115 . 5 0 . 8 114 . 7 114 . 9 0 . 2 114 . 7 D e f e rr e d t ax l i ab i l i t y 4 . 7 - 4 . 7 9 . 1 - 9 . 1 11 . 0 - 11 . 0 F i nan c e and o p e r a t i ng l e ase l i ab i l i t i e s, n e t o f 17 . 1 - 17 . 1 14 . 2 - 14 . 2 16 . 2 - 16 . 2 O t h e r l o n g - t e r m l i ab i l i t i e s 13 . 0 - 13 . 0 14 . 8 0 . 9 13 . 9 - - - L o n g - t e r m d e b t , n e t o f c u r r e nt p o r t i o n and 199 . 1 22 . 6 176 . 5 182 . 9 7 . 1 175 . 8 230 . 2 7 . 4 222 . 8 Total non - current liabilities 233.9 22 . 6 211 . 3 221 . 0 8 . 0 213 . 0 257 . 4 7 . 4 250 . 0 Total liabilities 390.1 27 . 5 362 . 6 336 . 5 8 . 8 327 . 7 372 . 3 7 . 6 364 . 7 Total mezzanine equity and stockholder's $ 553.3 139 . 9 419 . 9 $ 515 . 7 174 . 8 340 . 9 $ 444 . 9 204 . 0 240 . 9 September 30, 2022 December 31, 2021 December 31, 2020 www.apollomed.net 16
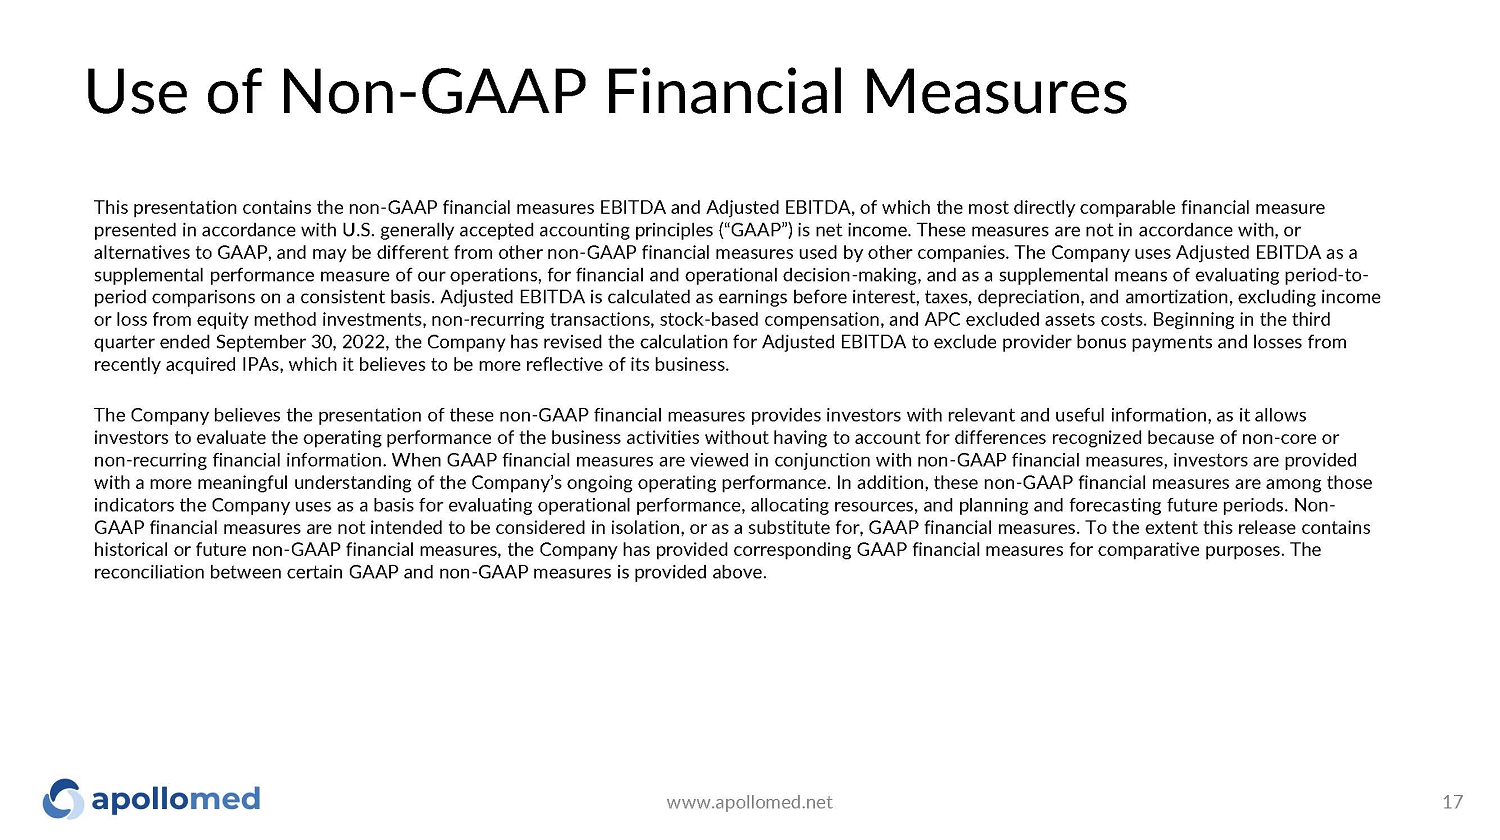
Use of Non - GAAP Financial Measures www.apollomed.net 17 This presentation contains the non - GAAP financial measures EBITDA and Adjusted EBITDA, of which the most directly comparable financial measure presented in accordance with U.S. generally accepted accounting principles (“GAAP”) is net income. These measures are not in accordance with, or alternatives to GAAP, and may be different from other non - GAAP financial measures used by other companies. The Company uses Adjusted EBITDA as a supplemental performance measure of our operations, for financial and operational decision - making, and as a supplemental means of evaluating period - to - period comparisons on a consistent basis. Adjusted EBITDA is calculated as earnings before interest, taxes, depreciation, and amortization, excluding income or loss from equity method investments, non - recurring transactions, stock - based compensation, and APC excluded assets costs. Beginning in the third quarter ended September 30, 2022, the Company has revised the calculation for Adjusted EBITDA to exclude provider bonus payments and losses from recently acquired IPAs, which it believes to be more reflective of its business. The Company believes the presentation of these non - GAAP financial measures provides investors with relevant and useful information, as it allows investors to evaluate the operating performance of the business activities without having to account for differences recognized because of non - core or non - recurring financial information. When GAAP financial measures are viewed in conjunction with non - GAAP financial measures, investors are provided with a more meaningful understanding of the Company’s ongoing operating performance. In addition, these non - GAAP financial measures are among those indicators the Company uses as a basis for evaluating operational performance, allocating resources, and planning and forecasting future periods. Non - GAAP financial measures are not intended to be considered in isolation, or as a substitute for, GAAP financial measures. To the extent this release contains historical or future non - GAAP financial measures, the Company has provided corresponding GAAP financial measures for comparative purposes. The reconciliation between certain GAAP and non - GAAP measures is provided above.

1 8 For inquiries, please contact: ApolloMed Investor Relations (626) 943 - 6491 investors@apollomed.net Carolyne Sohn, The Equity Group (408) 538 - 4577 csohn@equityny.com