EXHIBIT 99.2
Published on November 7, 2024
|
Third Quarter 2024 Earnings Supplement November 2024 , :s / k A I of di Astrana Health |

|
Forward Looking Statements This presentation contains forward-looking statements within the meaning of the Private Securities Litigation Reform Act of 1995, Section 27A of the Securities Act and Section 21E of the Exchange Act. Forward-looking statements include any statements about the Company's business, financial condition, operating results, plans, objectives, expectations and intentions, expansion plans, estimates of our total addressable market, our ability to successfully complete and realize the benefits of anticipated acquisitions, integration of acquired companies and any projections of earnings, revenue, EBITDA, Adjusted EBITDA or other financial items, such as the Company's projected capitation and future liquidity, and may be identified by the use of forward-looking terms such as "anticipate," "could," "can," "may," "might," "potential," "predict," "should," "estimate," "expect," "project," "believe," "plan," "envision," "intend," "continue," "target," "seek," "will," "would," and the negative of such terms, other variations on such terms or other similar or comparable words, phrases or terminology. Forward-looking statements reflect current views with respect to future events and financial performance and therefore cannot be guaranteed. Such statements are based on the current expectations and certain assumptions of the Company's management, and some or all of such expectations and assumptions may not materialize or may vary significantly from actual results. Actual results may also vary materially from forward-looking statements due to risks, uncertainties and other factors, known and unknown, including the risk factors described from time to time in the Company's reports to the U.S. Securities and Exchange Commission (the "SEC"), including without limitation the risk factors discussed in the Company's Annual Report on Form 10-K for the year ended December 31, 2023, and subsequent Quarterly Reports on Form 10-Q. Because the factors referred to above could cause actual results or outcomes to differ materially from those expressed or implied in any forward-looking statements, you should not place undue reliance on any such forward-looking statements. Any forward-looking statements speak only as of the date of this presentation and, unless legally required, the Company does not undertake any obligation to update any forward-looking statement, as a result of new information, future events or otherwise. This presentation may contain statistics and other data that in some cases has been obtained from or compiled from information made available by third-party service providers. The Company makes no representation or warranty, express or implied, with respect to the accuracy, reasonableness or completeness of such information. Use of Non-GAAP Financial Measures This presentation contains the non-GAAP financial measures EBITDA and Adjusted EBITDA, of which the most directly comparable financial measure presented in accordance with U.S. generally accepted accounting principles ("GAAP") is net income. These measures are not in accordance with, or alternatives to, GAAP, and may be calculated differently from similar non-GAAP financial measures used by other companies. The Company uses Adjusted EBITDA as a supplemental performance measure of our operations, for financial and operational decision-making, and as a supplemental means of evaluating period-to-period comparisons on a consistent basis. Adjusted EBITDA is calculated as earnings before interest, taxes, depreciation, and amortization, excluding income or loss from equity method investments, non-recurring and non-cash transactions, stock-based compensation, and APC excluded assets costs. Beginning in the third quarter ended September 30, 2022, the Company has revised the calculation for Adjusted EBITDA to exclude provider bonus payments and losses from recently acquired IPAs, which it believes to be more reflective of its business. The Company believes the presentation of these non-GAAP financial measures provides investors with relevant and useful information, as it allows investors to evaluate the operating performance of the business activities without having to account for differences recognized because of non-core or non-recurring financial information. When GAAP financial measures are viewed in conjunction with non-GAAP financial measures, investors are provided with a more meaningful understanding of the Company's ongoing operating performance. In addition, these non-GAAP financial measures are among those indicators the Company uses as a basis for evaluating operational performance, allocating resources, and planning and forecasting future periods. Non-GAAP financial measures are not intended to be considered in isolation, or as a substitute for, GAAP financial measures. Other companies may calculate both EBITDA and Adjusted EBITDA differently, limiting the usefulness of these measures for comparative purposes. To the extent this Presentation contains historical or future non-GAAP financial measures, the Company has provided corresponding GAAP financial measures for comparative purposes. The reconciliation between certain GAAP and non-GAAP measures is provided in the Appendix. The Company has not provided a quantitative reconciliation of applicable non-GAAP measures, such as the projected adjusted EBITDA and adjusted EBITDA margin in 2024 and in future years for planned acquisitions, to the most comparable GAAP measure, such as net income, on a forward-looking basis within this presentation because the Company is unable, without unreasonable efforts, to provide reconciling information with respect to certain line items that cannot be calculated. These items, which could materially affect the computation of forward-looking GAAP net income, are inherently uncertain and depend on various factors, some of which are outside of the Company's control. Astrana Health 2 |
|
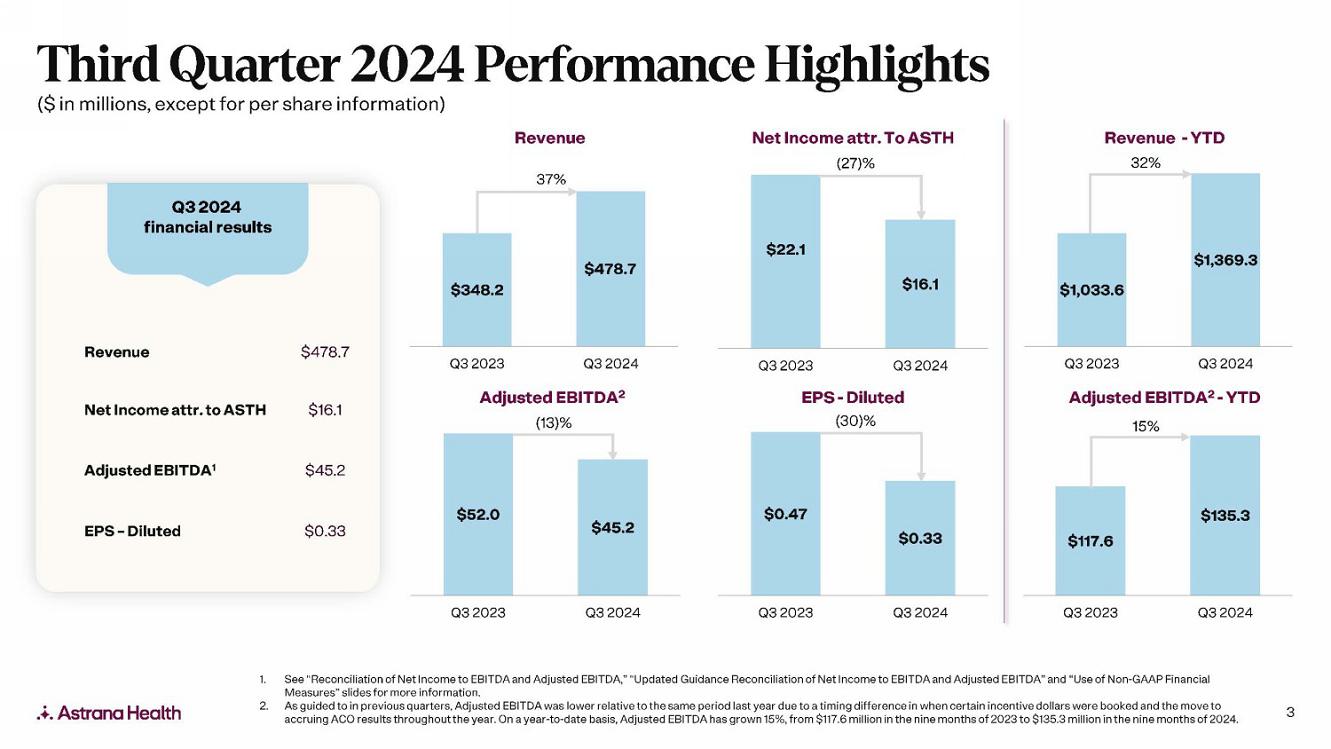
Third Quarter 2024 Performance Highlights ($ in millions, except for per share information) Q32024 financial results Revenue $478.7 Net Income attr. to ASTH $16.1 Adjusted EBITDA1 $45.2 EPS - Diluted $0.33 Astrana Health $348.2 Revenue 37% $478.7 Net Income attr. To ASTH (27)% $22.1 $16.1 Q3 2023 Q3 2024 Q3 2023 Q3 2024 Adjusted EBITDA2 EPS - Diluted (13)% (30)% $52.0 $45.2 $0.47 $0.33 Q3 2023 Q3 2024 Q3 2023 Q3 2024 1. See "Reconciliation of Net Income to EBITDA and Adjusted EBITDA," "Updated Guidance Reconciliation of Net Income to EBITDA and Adjusted EBITDA" and "Use of Non-GAAP Financial Measures" slides for more information. 2. As guided to in previous quarters, Adjusted EBITDA was lower relative to the same period last year due to a timing difference in when certain incentive dollars were booked and the move to accruing ACO results throughout the year. On a year-to-date basis, Adjusted EBITDA has grown 15%, from $117.6 million in the nine months of 2023 to $135.3 million in the nine months of 2024. 3 |
|
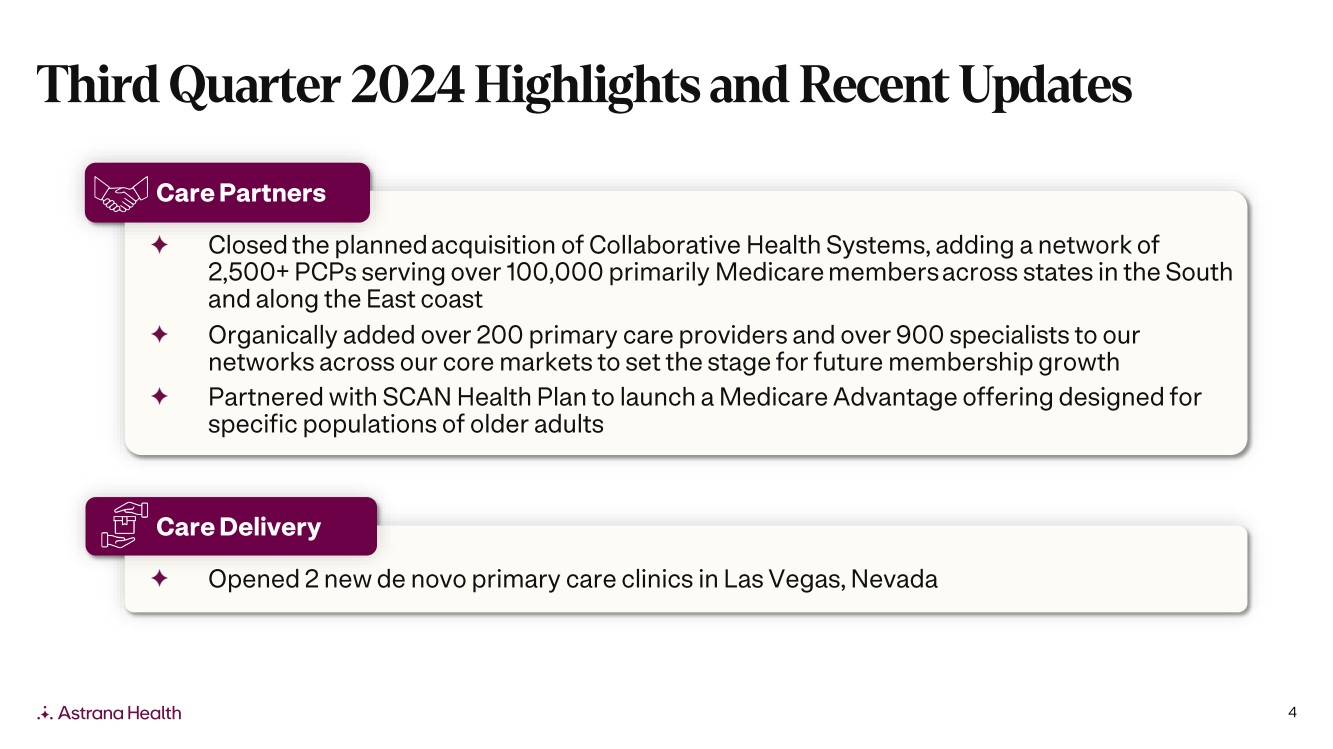
Third Quarter 2024 Highlights and Recent Updates Care Partners Closed the planned acquisition of Collaborative Health Systems, adding a network of 2,500+ PCPs serving over 100,000 primarily Medicare members across states in the South and along the East coast + Organically added over 200 primary care providers and over 900 specialists to our networks across our core markets to set the stage for future membership growth + Partnered with SCAN Health Plan to launch a Medicare Advantage offering designed for specific populations of older adults .. 20 Care Delivery I] . + Opened 2 new de novo primary care clinics in Las Vegas, Nevada .. . Astrana Health 4 |
|
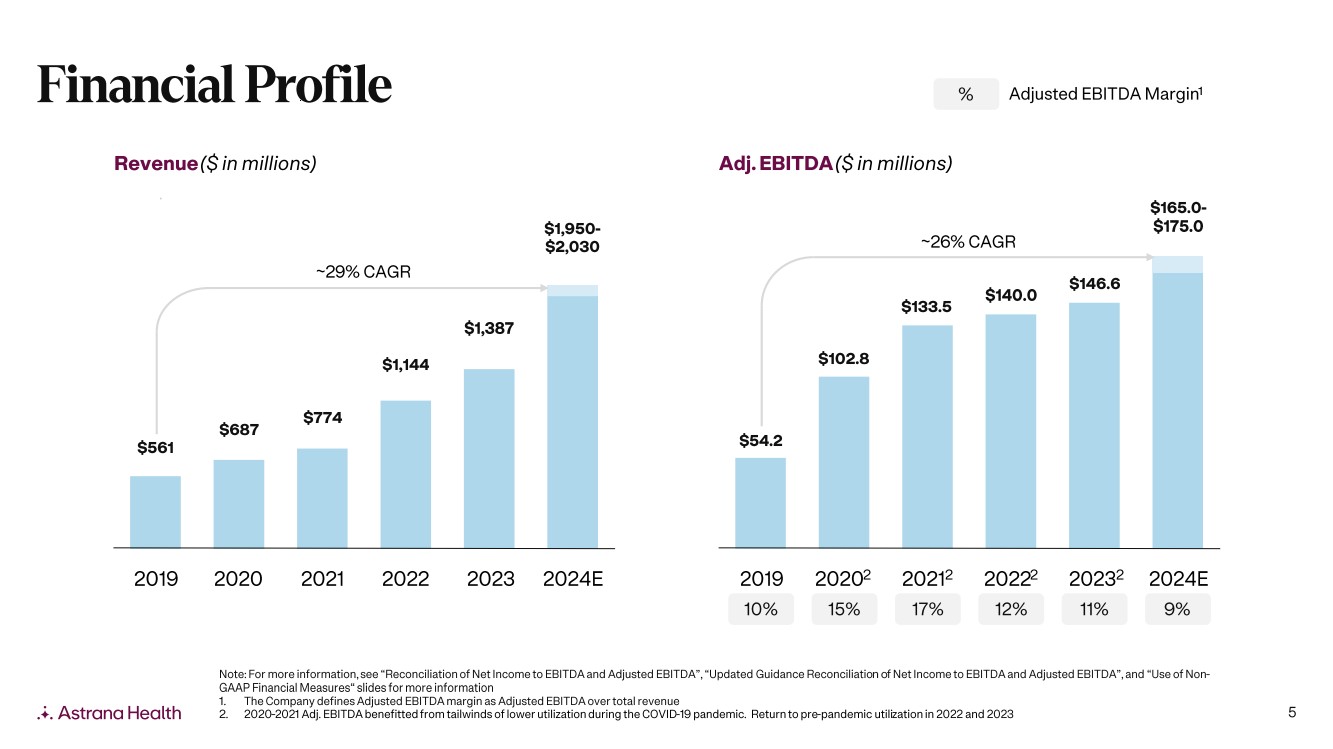
Financial Profile Revenue ($ in millions) Adj. EBITDA ($ in millions) $561 $687 -29% CAGR $774 $1,144 $1,387 % Adjusted EBITDA Margins $165.0- $1,950- $175.0 $2,030 -26% CAGR $54.2 $102.8 $140.0 $146.6 $133.5 2019 2020 2021 2022 2023 2024E 2019 20202 20212 20222 20232 2024E Astrana Health 10% 15% 17% 12% 11% 9% Note: For more information, see "Reconciliation of Net Income to EBITDA and Adjusted EBITDA", "Updated Guidance Reconciliation of Net Income to EBITDA and Adjusted EBITDA", and "Use of Non-GAAP Financial Measures" slides for more information 1. The Company defines Adjusted EBITDA margin as Adjusted EBITDA over total revenue 2. 2020-2021 Adj. EBITDA benefitted from tailwinds of lower utilization during the COVID-19 pandemic. Return to pre-pandemic utilization in 2022 and 2023 5 |
|
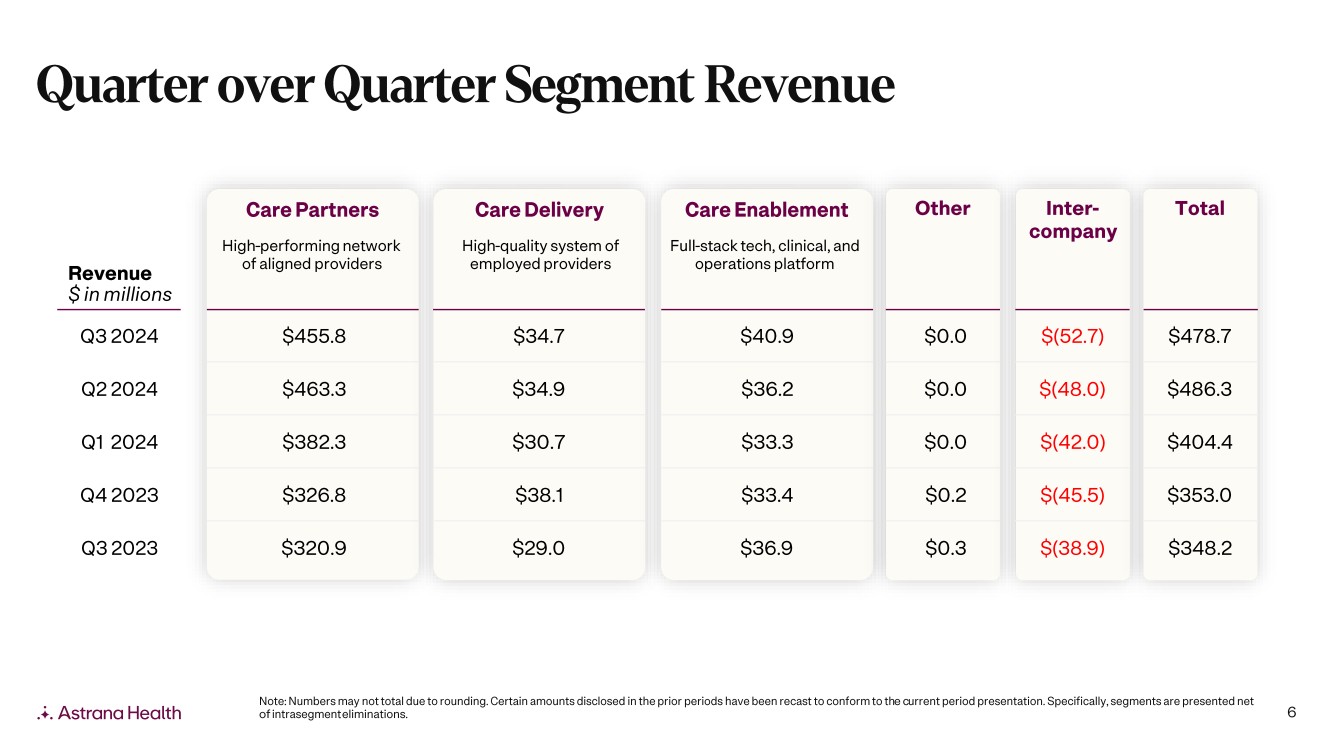
Quarter over Quarter Segment Revenue Revenue $ in millions Care Partners High-performing network of aligned providers Care Delivery High-quality system of employed providers Care Enablement Full-stack tech, clinical, and operations platform Other Inter-company Total Q3 2024 Q2 2024 Q1 2024 Q4 2023 Q3 2023 $455.8 $34.7 $40.9 $0.0 $(52.7) $478.7 $463.3 $34.9 $36.2 $0.0 $(48.0) $486.3 $382.3 $30.7 $33.3 $0.0 $(42.0) $404.4 $326.8 $38.1 $33.4 $0.2 $(45.5) $353.0 $320.9 $29.0 $36.9 $0.3 $(38.9) $348.2 .. . Astrana Health Note: Numbers may not total due to rounding. Certain amounts disclosed in the prior periods have been recast to conform to the current period presentation. Specifically, segments are presented net of intrasegment eliminations. 6 |
|
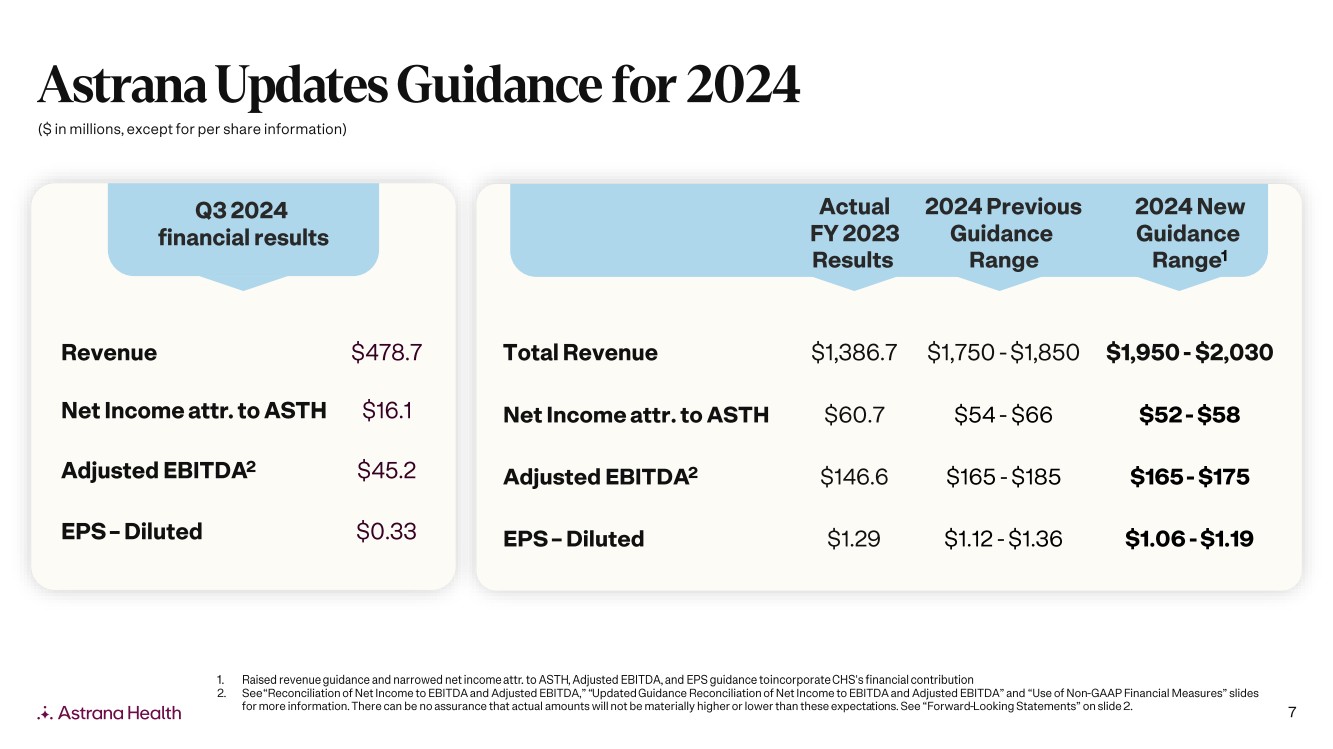
Astrana Updates Guidance for 2024 ($ in millions, except for per share information) Q32024 financial results Actual 2024 Previous 2024 New FY 2023 Guidance Guidance Results Range Ranges Revenue $478.7 Total Revenue $1,386.7 $1,750 - $1,850 $1,950 - $2,030 Net Income attr. to ASTH $16.1 Net Income attr. to ASTH $60.7 $54 - $66 $52 - $58 Adjusted EBITDA2 $45.2 Adjusted EBITDA2 $146.6 $165 - $185 $165 - $175 EPS - Diluted $0.33 EPS - Diluted $1.29 $1.12 - $1.36 $1.06 - $1.19 Astrana Health 1. Raised revenue guidance and narrowed net income attr. to ASTH, Adjusted EBITDA, and EPS guidance to incorporate CHS's financial contribution 2. See "Reconciliation of Net Income to EBITDA and Adjusted EBITDA," "Updated Guidance Reconciliation of Net Income to EBITDA and Adjusted EBITDA" and "Use of Non-GAAP Financial Measures" slides for more information. There can be no assurance that actual amounts will not be materially higher or lower than these expectations. See "Forward-Looking Statements" on slide 2. 7 |
|
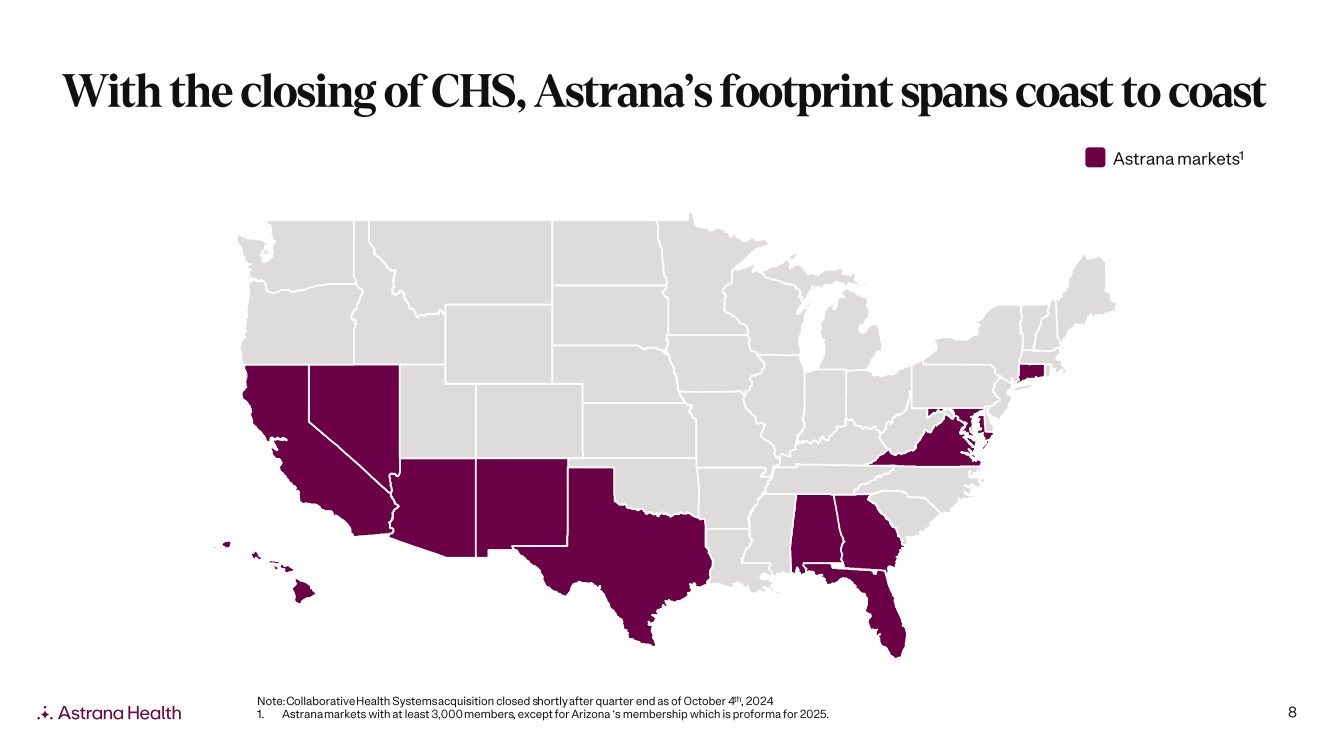
With the closing of CHS, Astrana's footprint spans coast to coast Astrana marketsl Jil ,At _ mew Astrana Health Note: Collaborative Health Systems acquisition closed shortly after quarter end as of October 4th, 2024 1. Astrana markets with at least 3,000 members, except for Arizona 's membership which is proforma for 2025. 8 |
|
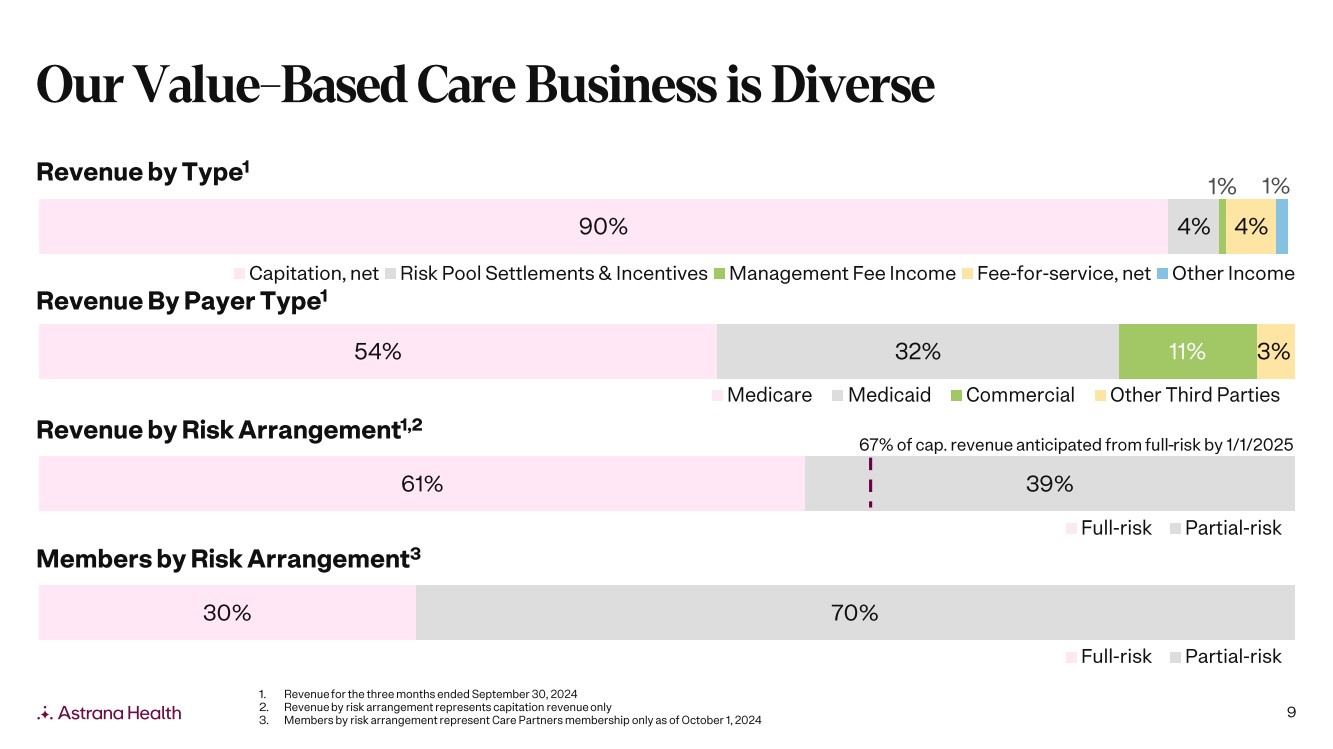
Our Value-Based Care Business is Diverse Revenue by Typel 90% 4% 4% Capitation, net Risk Pool Settlements & Incentives Management Fee Income Fee-for-service, net Other Income Revenue By Payer Typel 54% 32% 11% 3% Revenue by Risk Arrangementu Medicare Medicaid Commercial Other Third Parties 67% of cap. revenue anticipated from full-risk by 1/1/2025 61% i I 39% Full-risk Partial-risk Members by Risk Arrangement3 30% 70% .. . Astrana Health 1. Revenue for the three months ended September 30, 2024 2. Revenue by risk arrangement represents capitation revenue only 3. Members by risk arrangement represent Care Partners membership only as of October 1, 2024 Full-risk Partial-risk 9 |
|
Selected Financial Results .. . Astrana Health |

|
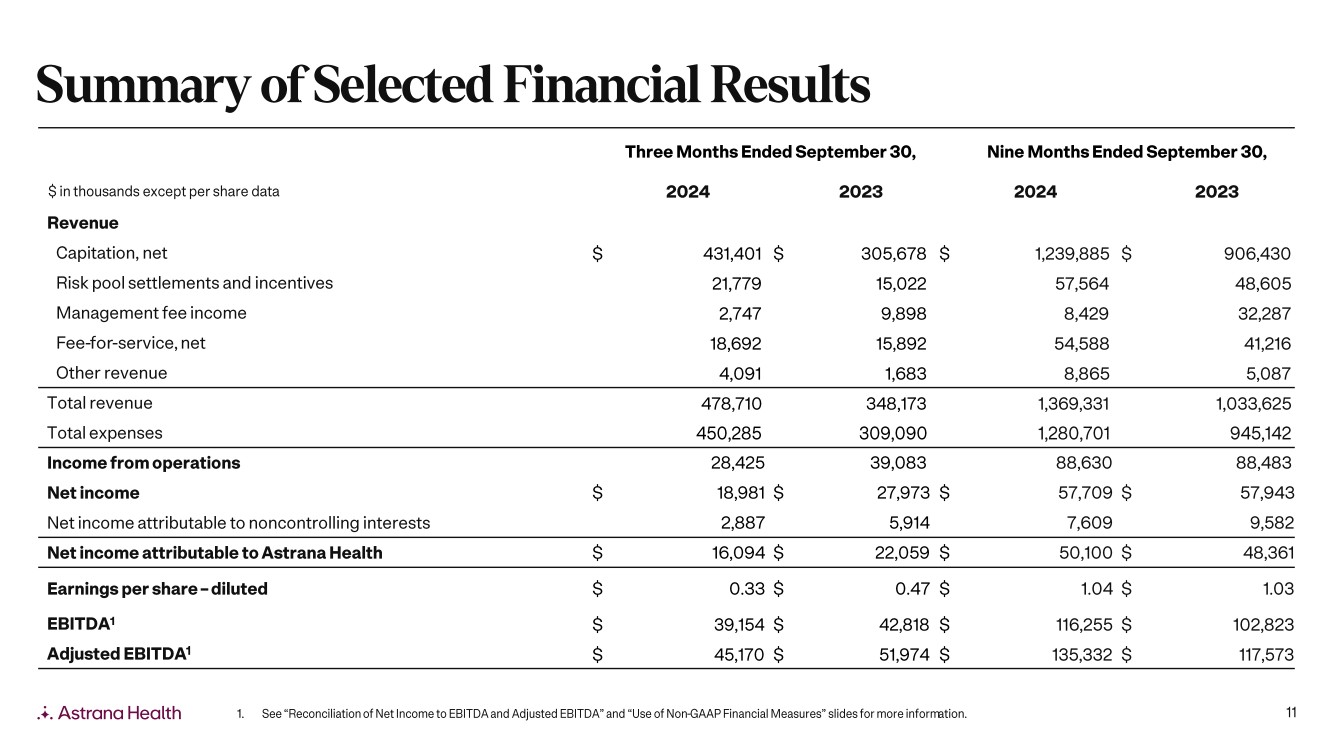
Summary of Selected Financial Results $ in thousands except per share data Revenue Three Months Ended September 30, 2024 2023 Nine Months Ended September 30, 2024 2023 Capitation, net 431,401 $ 305,678 $ 1,239,885 $ 906,430 Risk pool settlements and incentives 21,779 15,022 57,564 48,605 Management fee income 2,747 9,898 8,429 32,287 Fee-for-service, net 18,692 15,892 54,588 41,216 Other revenue 4,091 1,683 8,865 5,087 Total revenue 478,710 348,173 1,369,331 1,033,625 Total expenses 450,285 309,090 1,280,701 945,142 Income from operations 28,425 39,083 88,630 88,483 Net income 18,981 $ 27,973 $ 57,709 $ 57,943 Net income attributable to noncontrolling interests 2,887 5,914 7,609 9,582 Net income attributable to Astrana Health 16,094 $ 22,059 $ 50,100 $ 48,361 Earnings per share - diluted 0.33 $ 0.47 $ 1.04 $ 1.03 EBITDA1 39,154 $ 42,818 $ 116,255 $ 102,823 Adjusted EBITDA1 45,170 $ 51,974 $ 135,332 $ 117,573 Astrana Health 1. See "Reconciliation of Net Income to EBITDA and Adjusted EBITDA" and "Use of Non-GAAP Financial Measures" slides for more information. 11 |
|
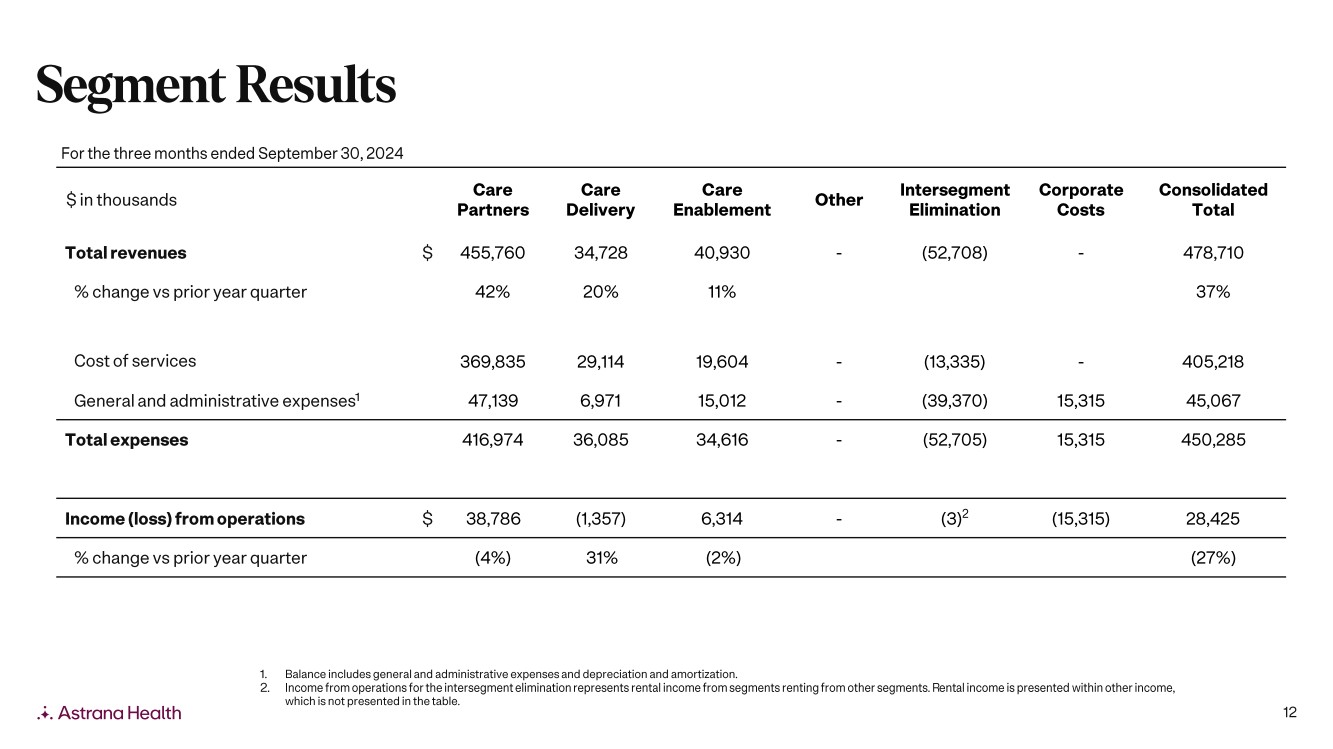
Segment Results For the three months ended September 30, 2024 $ in thousands Care Partners Care Delivery Care Enablement Other Intersegment Elimination Corporate Costs Consolidated Total Total revenues $ 455,760 34,728 40,930 - (52,708) - 478,710 % change vs prior year quarter 42% 20% 11% 37% Cost of services 369,835 29,114 19,604 (13,335) 405,218 General and administrative expenses' 47,139 6,971 15,012 (39,370) 15,315 45,067 Total expenses 416,974 36,085 34,616 (52,705) 15,315 450,285 Income (loss) from operations $ 38,786 (1,357) 6,314 (3)2 (15,315) 28,425 % change vs prior year quarter (4%) 31% (2%) (27%) Astrana Health 1. Balance includes general and administrative expenses and depreciation and amortization. 2. Income from operations for the intersegment elimination represents rental income from segments renting from other segments. Rental income is presented within other income, which is not presented in the table. 12 |
|
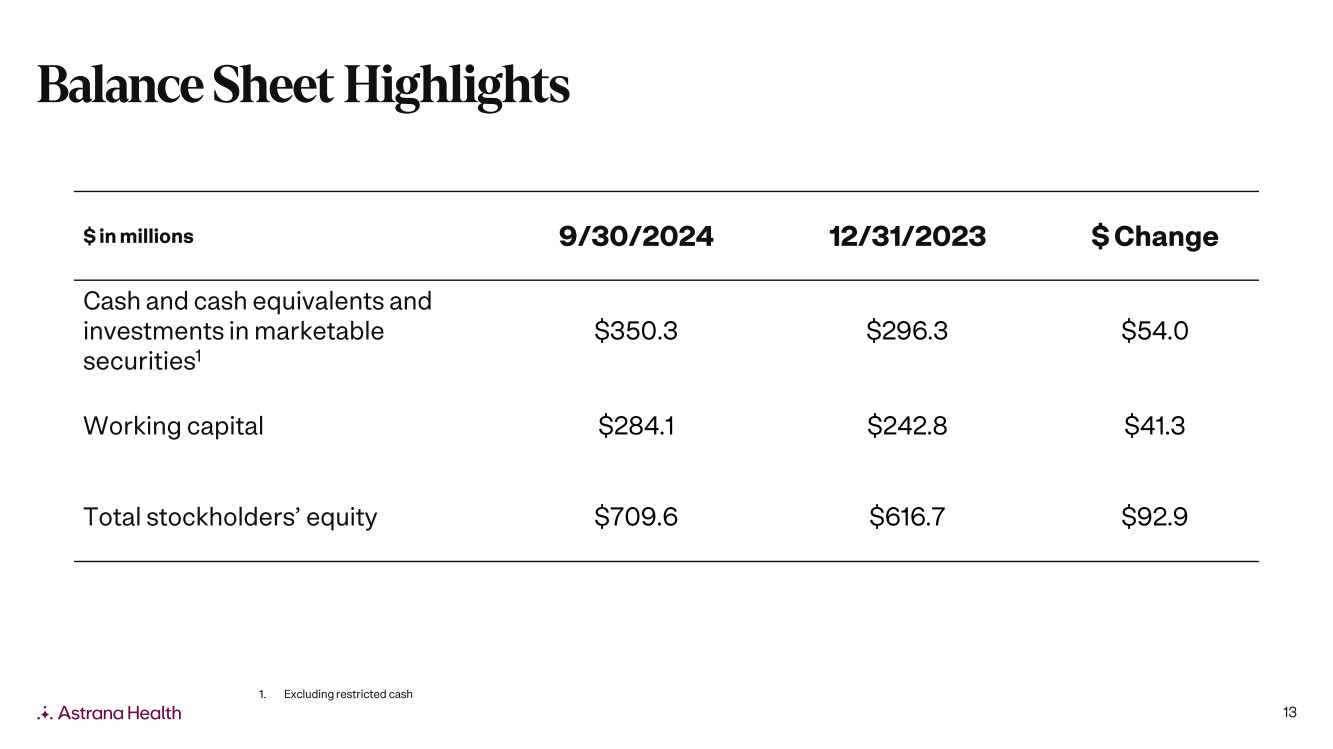
Balance Sheet Highlights $ in millions 9/30/2024 12/31/2023 $ Change Cash and cash equivalents and investments in marketable $350.3 $296.3 $54.0 securities1 Working capital $284.1 $242.8 $41.3 Total stockholders' equity $709.6 $616.7 $92.9 1. Excluding restricted cash .. . Astrana Health 13 |
|
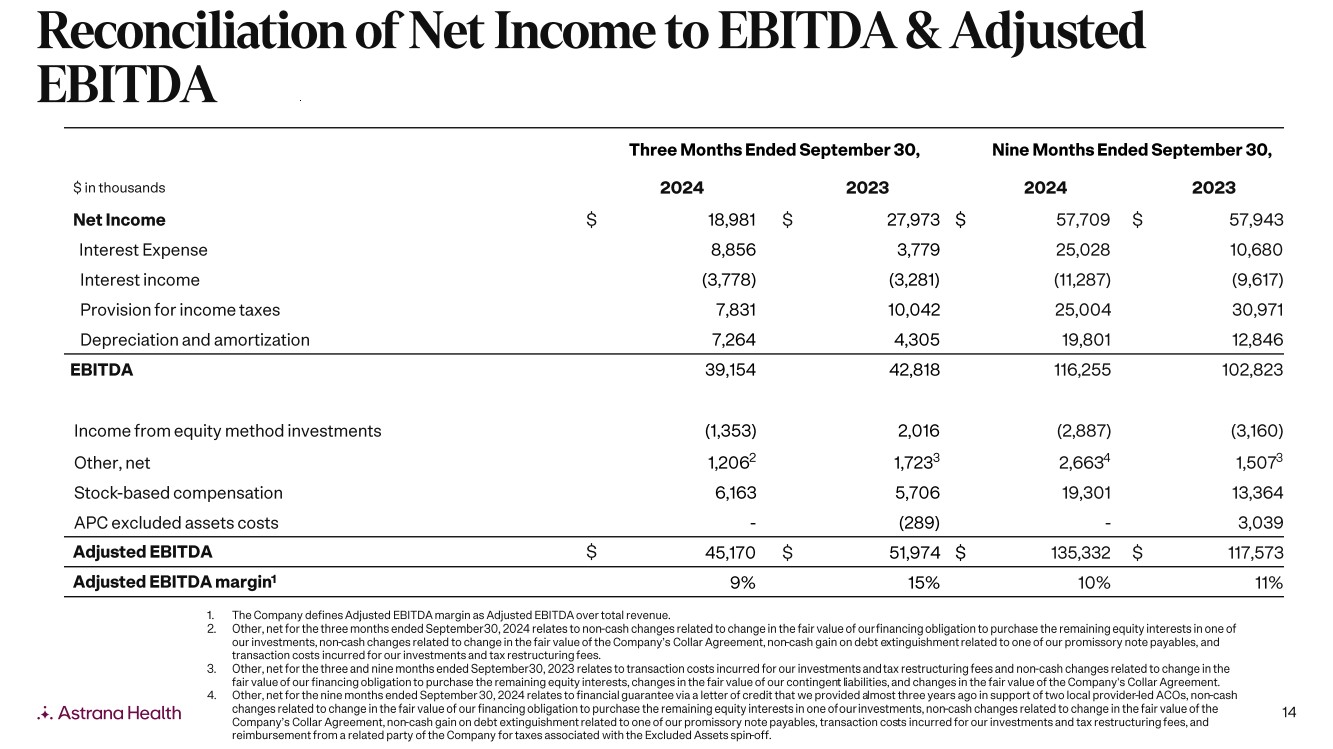
Reconciliation of Net Income to EBITDA & Adjusted EBITDA $ in thousands Three Months Ended September 30, 2024 2023 Nine Months Ended September 30, 2024 2023 Net Income 18,981 27,973 57,709 57,943 Interest Expense 8,856 3,779 25,028 10,680 Interest income (3,778) (3,281) (11,287) (9,617) Provision for income taxes 7,831 10,042 25,004 30,971 Depreciation and amortization 7,264 4,305 19,801 12,846 EBITDA 39,154 42,818 116,255 102,823 Income from equity method investments (1,353) 2,016 (2,887) (3,160) Other, net 1,2062 1,7233 2,6634 1,5073 Stock-based compensation 6,163 5,706 19,301 13,364 APC excluded assets costs (289) 3,039 Adjusted EBITDA 45,170 $ 51,974 $ 135,332 $ 117,573 Adjusted EBITDA margin' 9% 15% 10% 11% Astrana Health 1. The Company defines Adjusted EBITDA margin as Adjusted EBITDA over total revenue. 2. Other, net for the three months ended September 30, 2024 relates to non-cash changes related to change in the fair value of our financing obligation to purchase the remaining equity interests in one of our investments, non-cash changes related to change in the fair value of the Company's Collar Agreement, non-cash gain on debt extinguishment related to one of our promissory note payables, and transaction costs incurred for our investments and tax restructuring fees. 3. Other, net for the three and nine months ended September 30, 2023 relates to transaction costs incurred for our investments and tax restructuring fees and non-cash changes related to change in the fair value of our financing obligation to purchase the remaining equity interests, changes in the fair value of our contingent liabilities, and changes in the fair value of the Company's Collar Agreement. 4. Other, net for the nine months ended September 30, 2024 relates to financial guarantee via a letter of credit that we provided almost three years ago in support of two local provider-led ACOs, non-cash changes related to change in the fair value of our financing obligation to purchase the remaining equity interests in one of our investments, non-cash changes related to change in the fair value of the Company's Collar Agreement, non-cash gain on debt extinguishment related to one of our promissory note payables, transaction costs incurred for our investments and tax restructuring fees, and reimbursement from a related party of the Company for taxes associated with the Excluded Assets spin-off. |
|
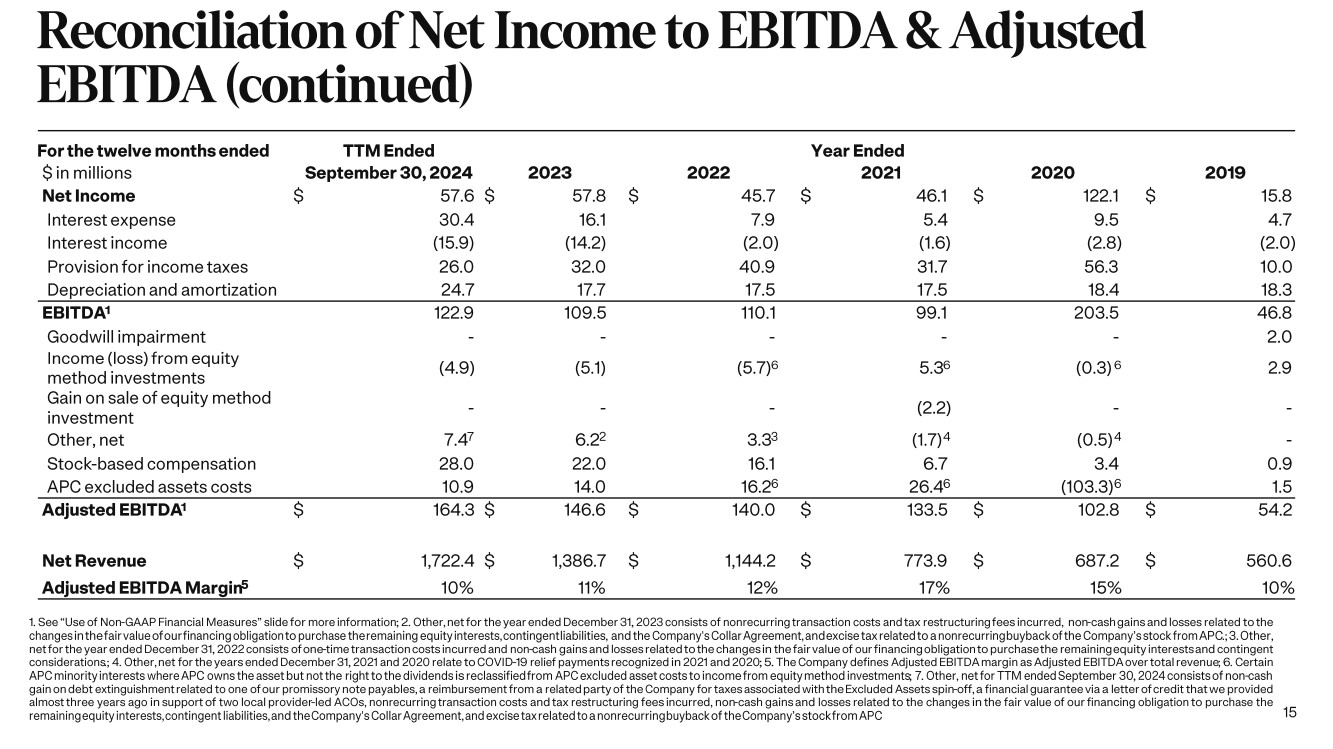
Reconciliation of Net Income to EBITDA & Adjusted EBITDA (continued) For the twelve months ended TTM Ended Year Ended $ in millions September 30, 2024 2023 2022 2021 2020 2019 Net Income $ 57.6 $ 57.8 $ 45.7 $ 46.1 $ 122.1 15.8 Interest expense 30.4 16.1 7.9 5.4 9.5 4.7 Interest income (15.9) (14.2) (2.0) (1.6) (2.8) (2.0) Provision for income taxes 26.0 32.0 40.9 31.7 56.3 10.0 Depreciation and amortization 24.7 17.7 17.5 17.5 18.4 18.3 EBITDA' 122.9 109.5 110.1 99.1 203.5 46.8 Goodwill impairment - - - - 2.0 Income (loss) from equity method investments (4.9) (5.1) (5.7)6 5.36 (0.3) 6 2.9 Gain on sale of equity method investment - - (2.2) Other, net 7.47 6.22 3.33 (1.7) 4 (0.5) 4 - Stock-based compensation 28.0 22.0 16.1 6.7 3.4 0.9 APC excluded assets costs 10.9 14.0 16.26 26.46 (103.3)6 1.5 Adjusted EBITDA1 164.3 $ 146.6 $ 140.0 $ 133.5 $ 102.8 $ 54.2 Net Revenue 1,722.4 $ 1,386.7 $ 1,144.2 $ 773.9 $ 687.2 $ 560.6 Adjusted EBITDA Margins 10% 11% 12% 17% 15% 10% 1. See "Use of Non-GAAP Financial Measures" slide for more information; 2. Other, net for the year ended December 31, 2023 consists of nonrecurring transaction costs and tax restructuring fees incurred, non-cash gains and losses related to the changes in the fair value of our financing obligation to purchase the remaining equity interests, contingent liabilities, and the Company's Collar Agreement, and excise tax related to a nonrecurring buyback of the Company's stock from APC.; 3. Other, net for the year ended December 31, 2022 consists of one-time transaction costs incurred and non-cash gains and losses related to the changes in the fair value of our financing obligation to purchase the remaining equity interests and contingent considerations.; 4. Other, net for the years ended December 31, 2021 and 2020 relate to COVID-19 relief payments recognized in 2021 and 2020; 5. The Company defines Adjusted EBITDA margin as Adjusted EBITDA over total revenue; 6. Certain APC minority interests where APC owns the asset but not the right to the dividends is reclassified from APC excluded asset costs to income from equity method investments; 7. Other, net for TTM ended September 30, 2024 consists of non-cash gain on debt extinguishment related to one of our promissory note payables, a reimbursement from a related party of the Company for taxes associated with the Excluded Assets spin-off, a financial guarantee via a letter of credit that we provided almost three years ago in support of two local provider-led ACOs, nonrecurring transaction costs and tax restructuring fees incurred, non-cash gains and losses related to the changes in the fair value of our financing obligation to purchase the remaining equity interests, contingent liabilities, and the Company's Collar Agreement, and excise tax related to a nonrecurring buyback of the Company's stock from APC 15 |
|
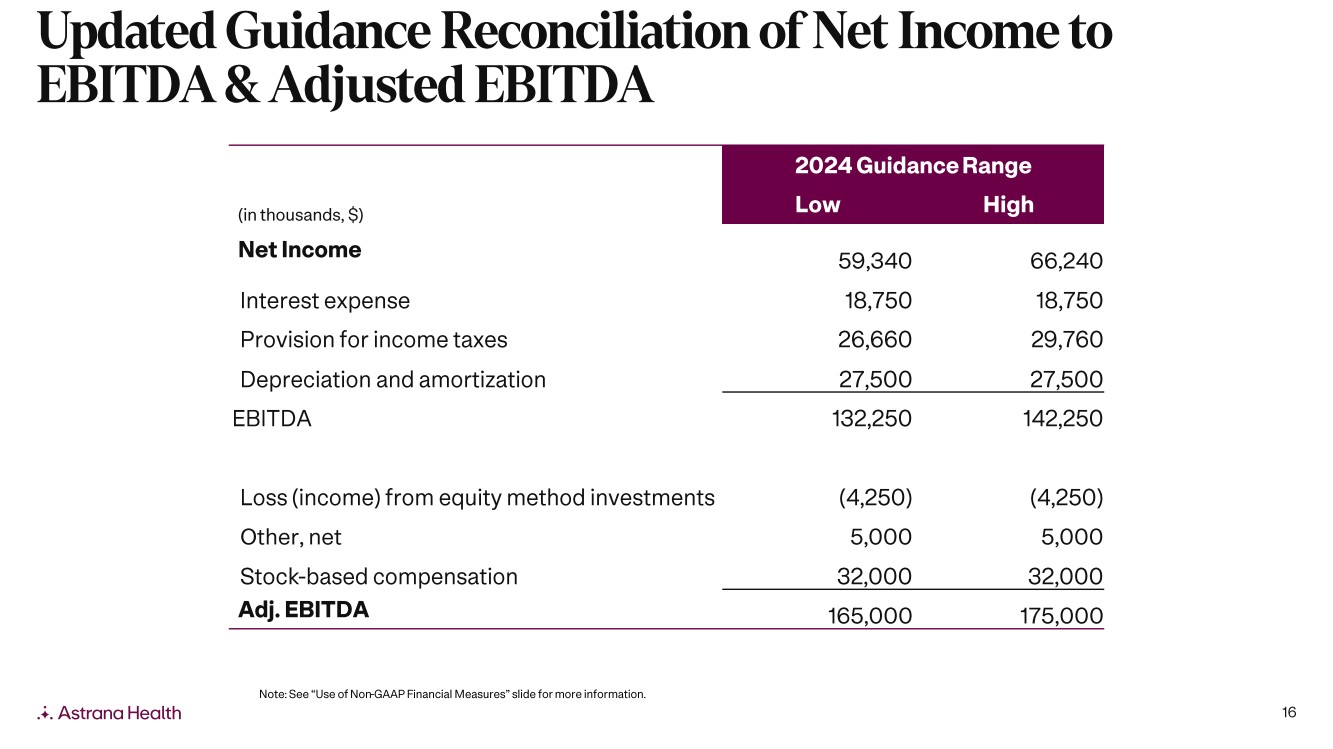
Updated Guidance Reconciliation of Net Income to EBITDA & Adjusted EBITDA 2024 Guidance Range (in thousands, $) Low High Net Income 59,340 66,240 Interest expense 18,750 18,750 Provision for income taxes 26,660 29,760 Depreciation and amortization 27,500 27,500 EBITDA 132,250 142,250 Loss (income) from equity method investments (4,250) (4,250) Other, net 5,000 5,000 Stock-based compensation 32,000 32,000 Adj. EBITDA 165,000 175,000 Note: See "Use of Non-GAAP Financial Measures" slide for more information. Astrana Health 16 |
|
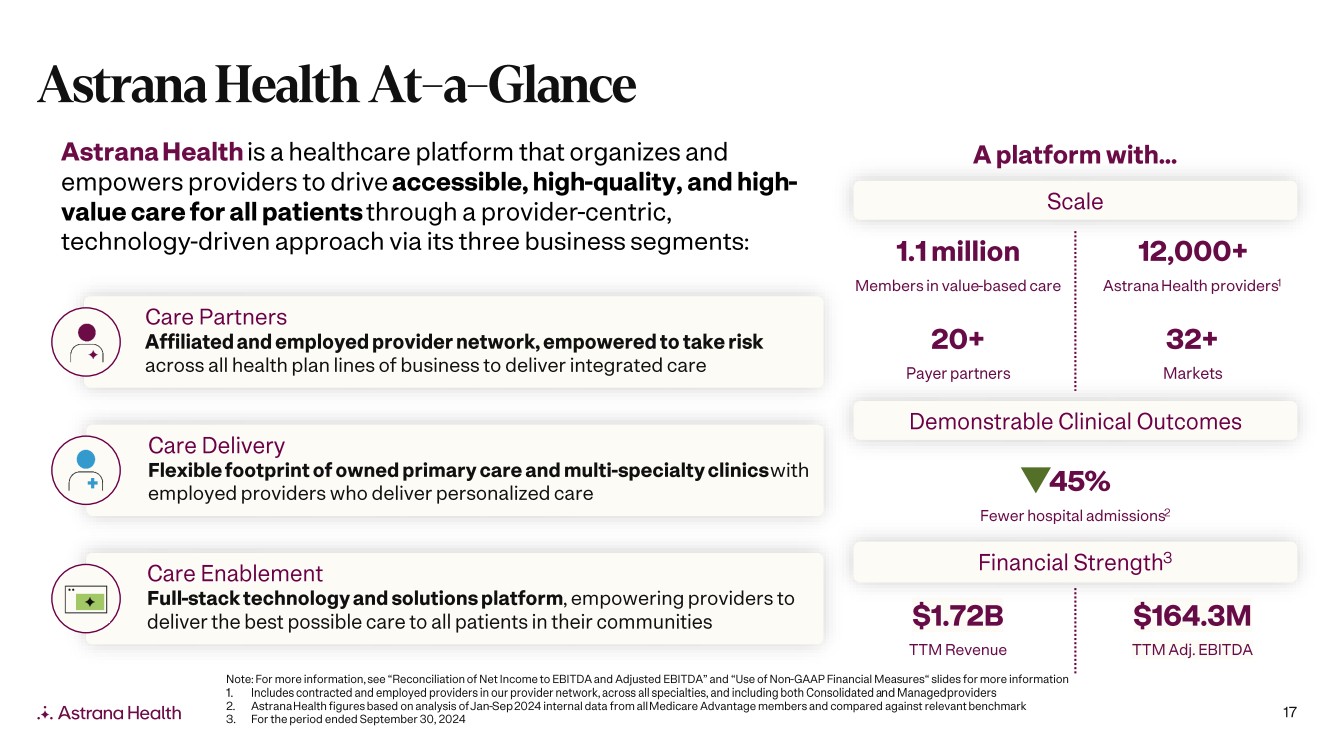
Astrana Health At-a-Glance Astrana Health is a healthcare platform that organizes and empowers providers to drive accessible, high-quality, and high-value care for all patients through a provider-centric, technology-driven approach via its three business segments: • n+) Care Partners Affiliated and employed provider network, empowered to take risk across all health plan lines of business to deliver integrated care Care Delivery Flexible footprint of owned primary care and multi-specialty clinics with employed providers who deliver personalized care Care Enablement Full-stack technology and solutions platform, empowering providers to deliver the best possible care to all patients in their communities Astrana Health A platform with... Scale 1.1million Members in value-based care 20+ Payer partners 12,000+ Astrana Health providers' 32+ Markets Demonstrable Clinical Outcomes v45% Fewer hospital admissions2 Financial Strength3 $1.72B TTM Revenue Note: For more information, see "Reconciliation of Net Income to EBITDA and Adjusted EBITDA" and "Use of Non-GAAP Financial Measures" slides for more information 1. Includes contracted and employed providers in our provider network, across all specialties, and including both Consolidated and Managed providers 2. Astrana Health figures based on analysis of Jan-Sep 2024 internal data from all Medicare Advantage members and compared against relevant benchmark 3. For the period ended September 30, 2024 $164.3M TTM Adj. EBITDA 17 |
|
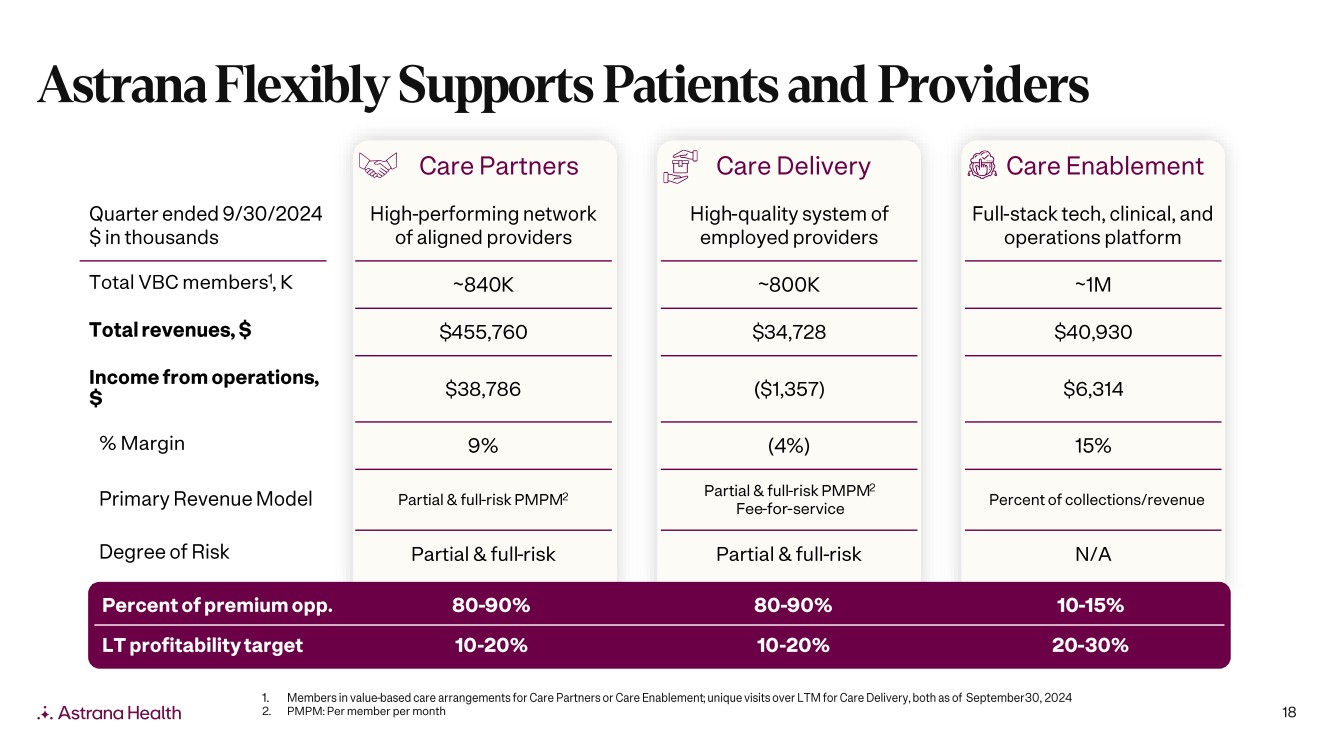
Astrana Flexibly Supports Patients and Providers Quarter ended 9/30/2024 $ in thousands Total VBC membersl, K Total revenues, $ Income from operations, % Margin Primary Revenue Model Degree of Risk Care Partners High-performing network of aligned providers in Care Delivery High-quality system of employed providers 47) Care Enablement Full-stack tech, clinical, and operations platform -840K -800K -1M $455,760 $34,728 $40,930 $38,786 ($1,357) $6,314 9% (4%) 15% Partial & full-risk PM PM2 Partial & full-risk Partial & full-risk PM PM2 Fee-for-service Partial & full-risk Percent of collections/revenue N/A Percent of premium opp. 80-90% 80-90% 10-15% LT profitability target 10-20% 10-20% 20-30% Astrana Health 1. Members in value-based care arrangements for Care Partners or Care Enablement; unique visits over LTM for Care Delivery, both as of September 30, 2024 2. PMPM: Per member per month 18 |
|
0 AMR inve rr o Investor Relations Asher Dewhurst (626) 943-6491 a anahealth.com Agtrana Health |