EXHIBIT 99.2
Published on May 7, 2026
Exhibit 99.2

May 2026 First Quarter 2026 Earnings Supplement
2 Forward Looking Statements This presentation contains forward - looking statements within the meaning of the Private Securities Litigation Reform Act of 1995 , Section 27A of the Securities Act and Section 21E of the Exchange Act. Forward - looking statements include any statements about the Company's business, financial condition, operating results, plans, objectives, expectations and intentions, expansion plans, est imates of our total addressable market, our ability to successfully complete and realize the benefits of anticipated acquisit ion s, integration of acquired companies and any projections of earnings, revenue, EBITDA, Adjusted EBITDA, adjusted EPS - diluted or o ther financial items, such as the Company's projected capitation and future liquidity, as well as statements regarding the ma ter ial weakness in internal control over financial reporting and the Company’s ability to remediate such material weakness in a time ly manner and may be identified by the use of forward - looking terms such as “anticipate,” “could,” “can,” “may,” “might,” “potentia l,” “predict,” “should,” “estimate,” “expect,” “project,” “believe,” “plan,” “envision,” “intend,” “continue,” “target,” “seek,” “wi ll,” “would,” and the negative of such terms, other variations on such terms or other similar or comparable words, phrases or te rminology. Forward - looking statements reflect current views with respect to future events and financial performance and therefore cannot be guaranteed. Such statements are based on the current expectations and certain assumptions of the Company’s management, and some or all of such expectations and assumptions may not materialize or may vary significantly from actual results. Actual re sul ts may also vary materially from forward - looking statements due to risks, uncertainties and other factors, known and unknown, including the risk factors described from time to time in the Company’s reports to the U.S. Securities and Exchange Commissio n ( the “SEC”), including without limitation the risk factors discussed in the Company’s last Annual Report on Form 10 - K and subsequ ent quarterly reports on Form 10 - Q filed with the SEC. Because the factors referred to above could cause actual results or outcomes to differ materially from those expressed or imp lie d in any forward - looking statements, you should not place undue reliance on any such forward - looking statements. Any forward - looking statements speak only as of the date of this presentation and, unless legally required, the Company does not undertak e a ny obligation to update any forward - looking statement, as a result of new information, future events or otherwise. This presentation may contain statistics and other data that in some cases has been obtained from or compiled from informatio n m ade available by third - party service providers. The Company makes no representation or warranty, express or implied, with respec t to the accuracy, reasonableness or completeness of such information. Use of Non - GAAP Financial Measures This presentation contains the non - GAAP financial measures EBITDA, Adjusted EBITDA, Adjusted EBITDA margin, adjusted net income attributable to Astrana , and adjusted EPS – diluted of which the most directly comparable financial measure presented in accordance with U.S. generally accepted accounting principles (“GAAP”) is net income. This presentation also contains the non - GA AP financial measure free cash flow, of which the most directly comparable financial measure presented in accordance with U.S GAAP is net cash provided by operating activities. These measures are not in accordance with, or alternatives to, GAAP, and m ay be calculated differently from similar non - GAAP financial measures used by other companies. The Company uses Adjusted EBITDA, Adjusted EBITDA margin, adjusted EPS – diluted, and free cash flow as supplemental performance measures of our operations, for f inancial and operational decision - making, and as supplemental means of evaluating period - to - period comparisons on a consistent basis, and, for free cash flow, to reflect the cash flow trends in our business. Adjusted EBITDA is calculated as earnings be for e interest expense, interest income, income taxes, depreciation, and amortization, excluding income or loss from equity metho d investments, non - recurring and non - cash transactions, stock - based compensation, and, for periods on or prior to December 31, 202 3, APC excluded assets costs. Beginning in the third quarter ended September 30, 2022, the Company has revised the calculati on for Adjusted EBITDA to exclude provider bonus payments and losses from recently acquired IPAs, which it believes to be more r efl ective of its business. The Company defines Adjusted EBITDA margin as Adjusted EBITDA over total revenue. Adjusted net income attributable to Astrana is calculated as net income, excluding income or loss from equity method investments, non - recurring and non - cash transactions, stock - based compensation, amortization of intangible assets attributable to acquisitions, certain tax adjustments, and amounts related to net income or loss attributable to non - controlling interests . The Company defines adjusted EPS - diluted as adjusted net income attributable to Astrana over weighted average shares of common stock outstanding - diluted. The Company defines free cash flow as net cash provided by operating activities minus cash used in purchases of property and equ ipment. The Company believes the presentation of these non - GAAP financial measures provides investors with relevant and useful informati on, as it allows investors to evaluate the operating performance of the business activities without having to account for differences recognized because of non - core or non - recurring financial information. When GAAP financial measures are viewed in co njunction with non - GAAP financial measures, investors are provided with a more meaningful understanding of the Company’s ongoing operating performance. In addition, these non - GAAP financial measures are among those indicators the Company uses as a b asis for evaluating operational performance, allocating resources, and planning and forecasting future periods. Non - GAAP financial measures are not intended to be considered in isolation, or as a substitute for, GAAP financial measures. Other com pan ies may calculate EBITDA, Adjusted EBITDA, Adjusted EBITDA margin, adjusted net income attributable to Astrana , adjusted EPS – diluted, and free cash flow differently, limiting the usefulness of these measures for comparative purposes. To the extent th is Presentation contains historical or future non - GAAP financial measures, the Company has provided corresponding GAAP financial measures for comparative purposes. The reconciliation between certain GAAP and non - GAAP measures is provided in the Appendix. The Company has not provided a quantitative reconciliation of applicable non - GAAP measures, such as the projected adjusted EBITD A to the most comparable GAAP measure, such as net income, on a forward - looking basis within this presentation because the Company is unable, without unreasonable efforts, to provide reconciling information with respect to certain line items that c ann ot be calculated. These items, which could materially affect the computation of forward - looking GAAP net income, are inherently uncertain and depend on various factors, some of which are outside of the Company’s control. 1 2 3
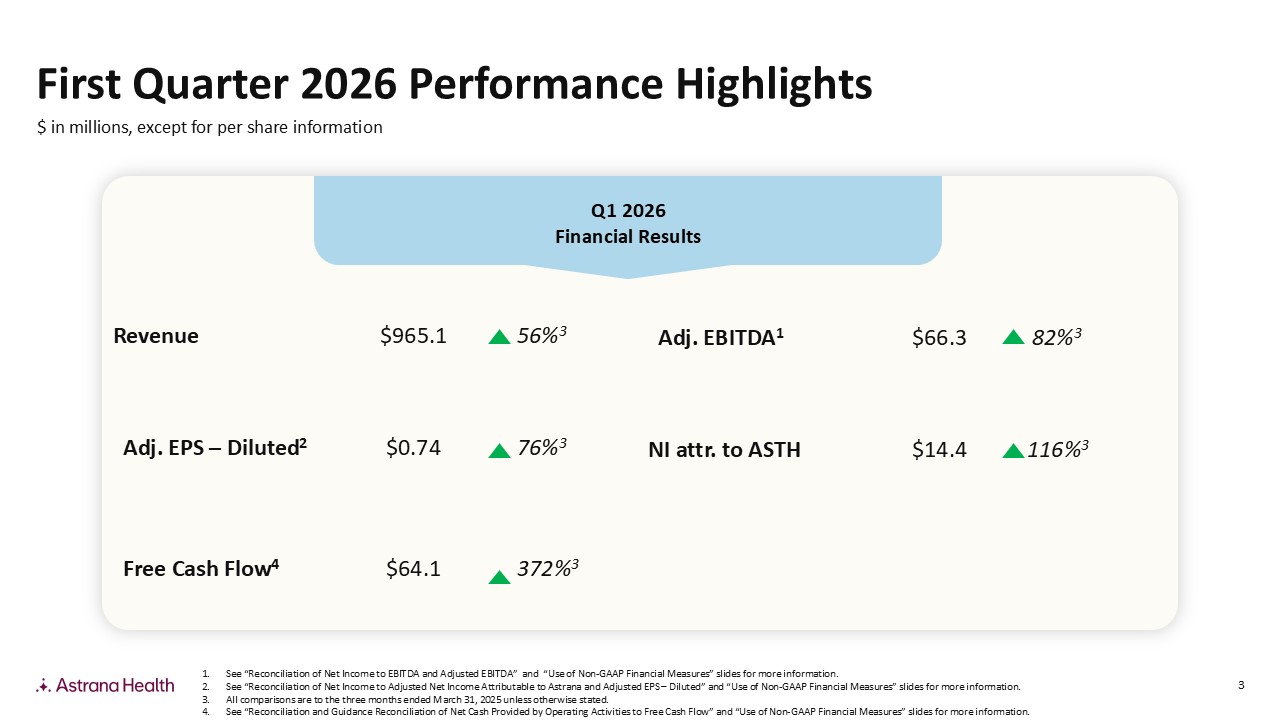
3 Q1 2026 Financial Results 56% 3 $965.1 Revenue 76% 3 $0.74 Adj. EPS – Diluted 2 372% 3 $64.1 Free Cash Flow 4 First Quarter 2026 Performance Highlights $ in millions, except for per share information 1. See “Reconciliation of Net Income to EBITDA and Adjusted EBITDA” and “Use of Non - GAAP Financial Measures” slides for more info rmation. 2. See “Reconciliation of Net Income to Adjusted Net Income Attributable to Astrana and Adjusted EPS – Diluted” and “Use of Non - GAAP Financial Measures” slides for more information. 3. All comparisons are to the three months ended March ௗ 31, 2025 unless otherwise stated. 4. See “Reconciliation and Guidance Reconciliation of Net Cash Provided by Operating Activities to Free Cash Flow” and “Use of N on - GAAP Financial Measures” slides for more information. 82% 3 $66.3 Adj. EBITDA 1 116% 3 $14.4 NI attr. to ASTH AS1JZ2JZ3AS4AS5 AH6 AH7 TB8
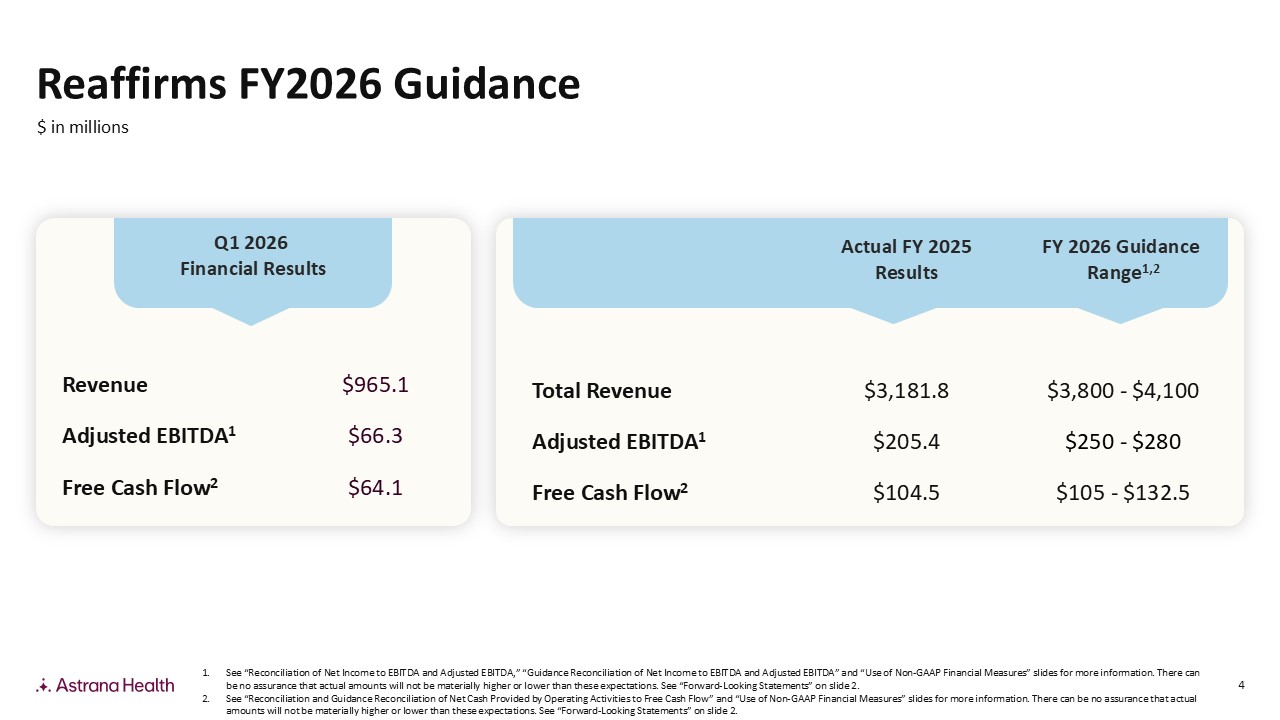
4 FY 2026 Guidance Range 1,2 Actual FY 2025 Results $3,800 - $4,100 $3,181.8 Total Revenue $250 - $280 $205.4 Adjusted EBITDA 1 $105 - $132.5 $104.5 Free Cash Flow 2 Q1 2026 Financial Results $965.1 Revenue $66.3 Adjusted EBITDA 1 $64.1 Free Cash Flow 2 1. See “Reconciliation of Net Income to EBITDA and Adjusted EBITDA,” “Guidance Reconciliation of Net Income to EBITDA and Adjust ed EBITDA” and “Use of Non - GAAP Financial Measures” slides for more information. There can be no assurance that actual amounts will not be materially higher or lower than these expectations. See “Forward - Looking Stateme nts” on slide 2. 2. See “ Reconciliation and Guidance Reconciliation of Net Cash Provided by Operating Activities to Free Cash Flow ” and “Use of Non - GAAP Financial Measures” slides for more information. There can be no assurance that actual amounts will not be materially higher or lower than these expectations. See “Forward - Looking Statements” on slide 2. $ in millions Reaffirms FY2026 GuidanceAS1
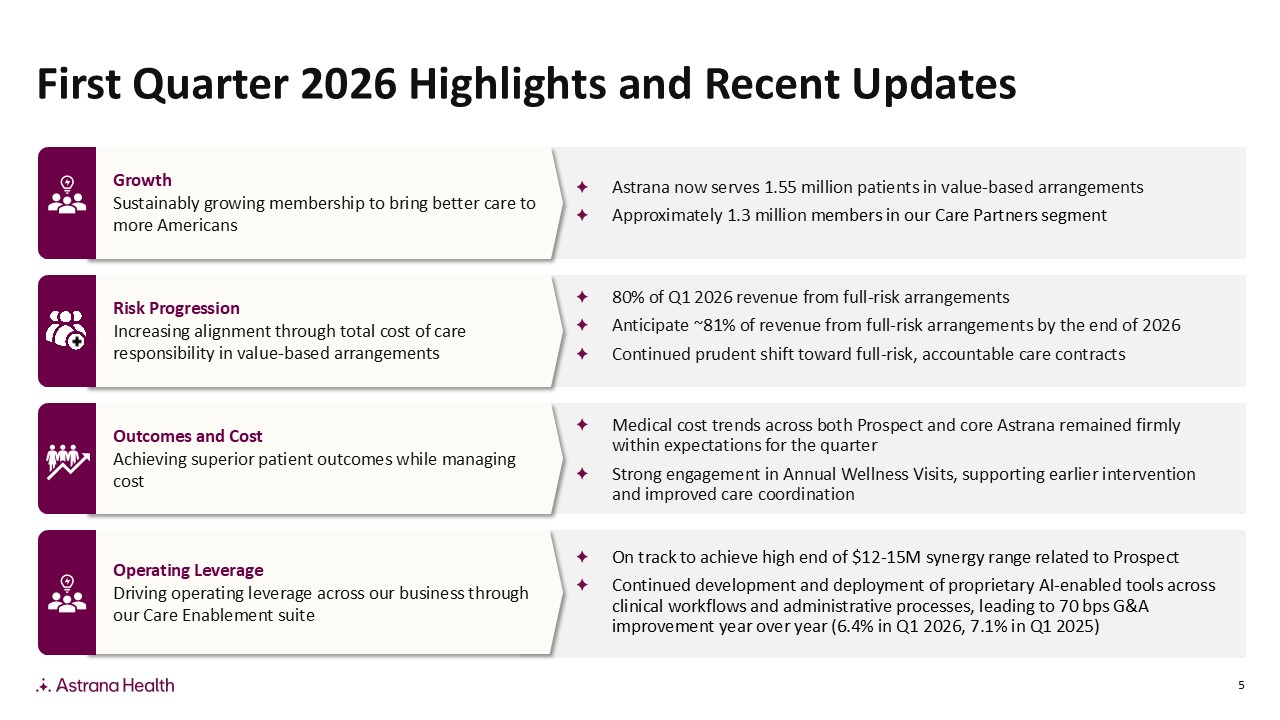
5 Growth Sustainably growing membership to bring better care to more Americans Astrana now serves 1.55 million patients in value - based arrangements Approximately 1.3 million m embers in our Care Partners segment Growth First Quarter 2026 Highlights and Recent Updates Operating Leverage Driving operating leverage across our business through our Care Enablement suite On track to achieve high end of $12 - 15M synergy range related to Prospect Continued development and deployment of proprietary AI - enabled tools across clinical workflows and administrative processes, leading to 70 bps G&A improvement year over year (6.4% in Q1 2026, 7.1% in Q1 2025) Risk Progression Increasing alignment through total cost of care responsibility in value - based arrangements 80 % of Q1 2026 revenue from full - risk arrangements Anticipate ~ 81% of revenue from full - risk arrangements by the end of 2026 Continued prudent shift toward full - risk , accountable care contracts Outcomes and Cost Achieving superior patient outcomes while managing cost Medical cost trends across both Prospect and core Astrana remained firmly within expectations for the quarter Strong engagement in Annual Wellness Visits, supporting earlier intervention and improved care coordination AS1 AS2 AS3 AS4
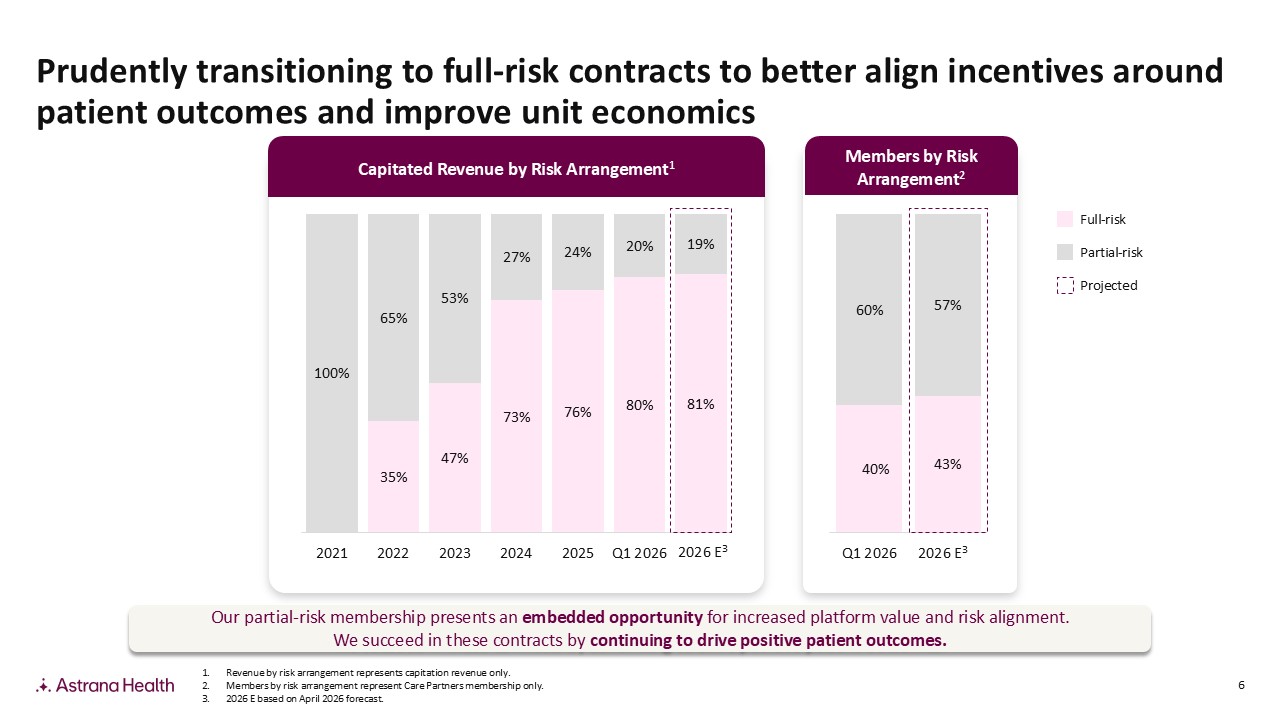
6 Projected Full - risk Partial - risk Members by Risk Arrangement 2 35% 47% 73% 76% 80% 81% 100% 65% 53% 27% 24% 20% 19% 2021 2022 2023 2024 2025 Q1 2026 2026 E 40% 43% 60% 57% Q1 2026 2026 E Capitated Revenue by Risk Arrangement 1 Our partial - risk membership presents an embedded opportunity for increased platform value and risk alignment. We succeed in these contracts by continuing to drive positive patient outcomes. 1. Revenue by risk arrangement represents capitation revenue only. 2. Members by risk arrangement represent Care Partners membership only. 3. 2026 E based on April 2026 forecast. Prudently transitioning to full - risk contracts to better align incentives around patient outcomes and improve unit economics 2026 E 3 2026 E 3AS1 JZ2 AS3CB4
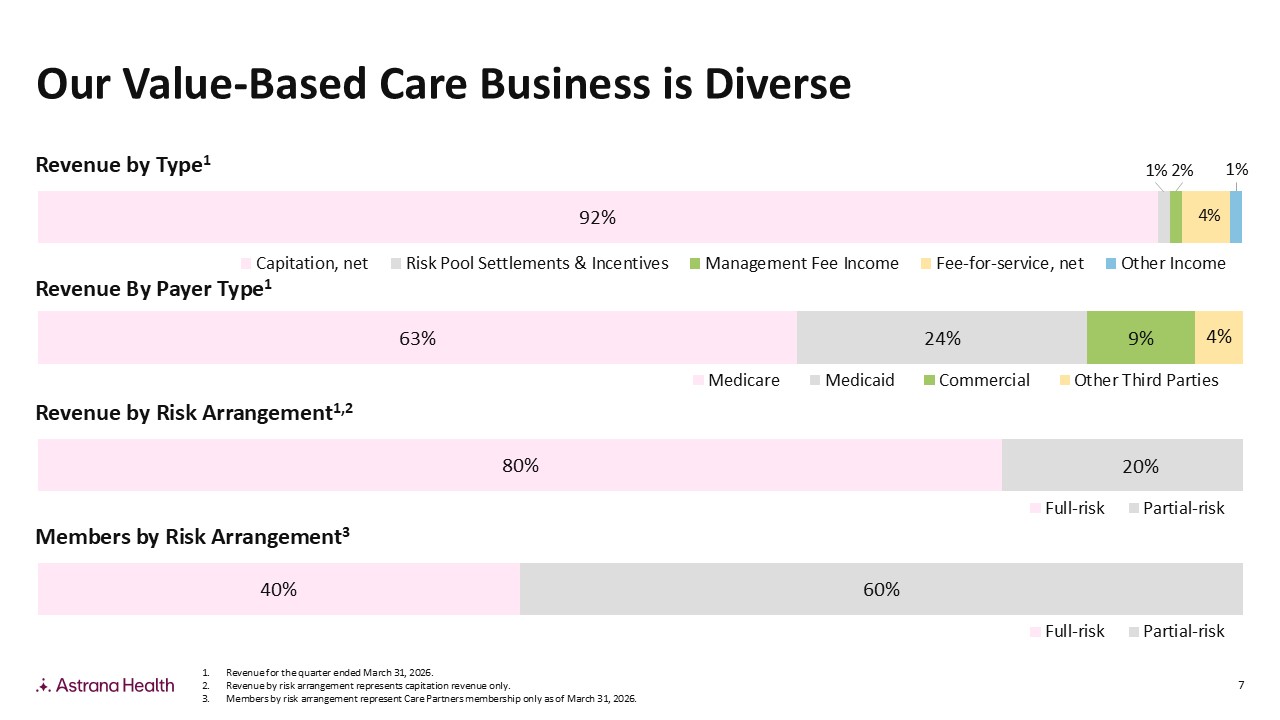
7 92% 1% 2% 4% Capitation, net Risk Pool Settlements & Incentives Management Fee Income Fee-for-service, net Other Income Revenue by Type 1 63% 24% 9% 4% Medicare Medicaid Commercial Other Third Parties Revenue By Payer Type 1 80% 20% Full-risk Partial-risk Revenue by Risk Arrangement 1,2 40% 60% Full-risk Partial-risk Members by Risk Arrangement 3 Our Value - Based Care Business is Diverse 1% 1. Revenue for the quarter ended March 31, 2026. 2. Revenue by risk arrangement represents capitation revenue only. 3. Members by risk arrangement represent Care Partners membership only as of March 31, 2026.AS1 JZ2 DH3 AS4
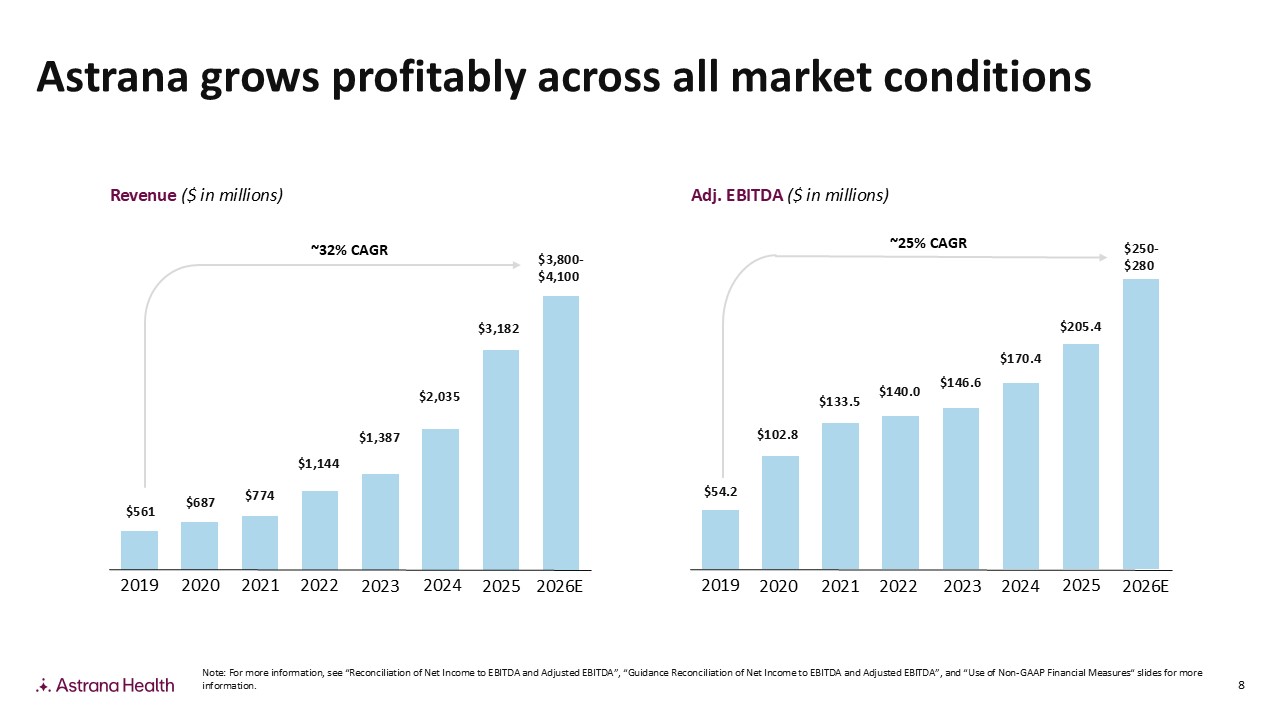
8 Revenue ($ in millions) Adj. EBITDA ($ in millions) $561 $687 $774 $1,144 $1,387 $2,035 $3,182 2019 2020 2021 2022 2023 ~32% CAGR 2024 $54.2 $102.8 $133.5 $140.0 $146.6 $170.4 $205.4 2019 2020 2021 2022 2023 2024 ~25% CAGR 2025 $3,800 - $4,100 $250 - $280 2026E 2026E 2025 Astrana grows profitably across all market conditions Note: For more information, see “Reconciliation of Net Income to EBITDA and Adjusted EBITDA”, “Guidance Reconciliation of Net In come to EBITDA and Adjusted EBITDA”, and “Use of Non - GAAP Financial Measures“ slides for more information.
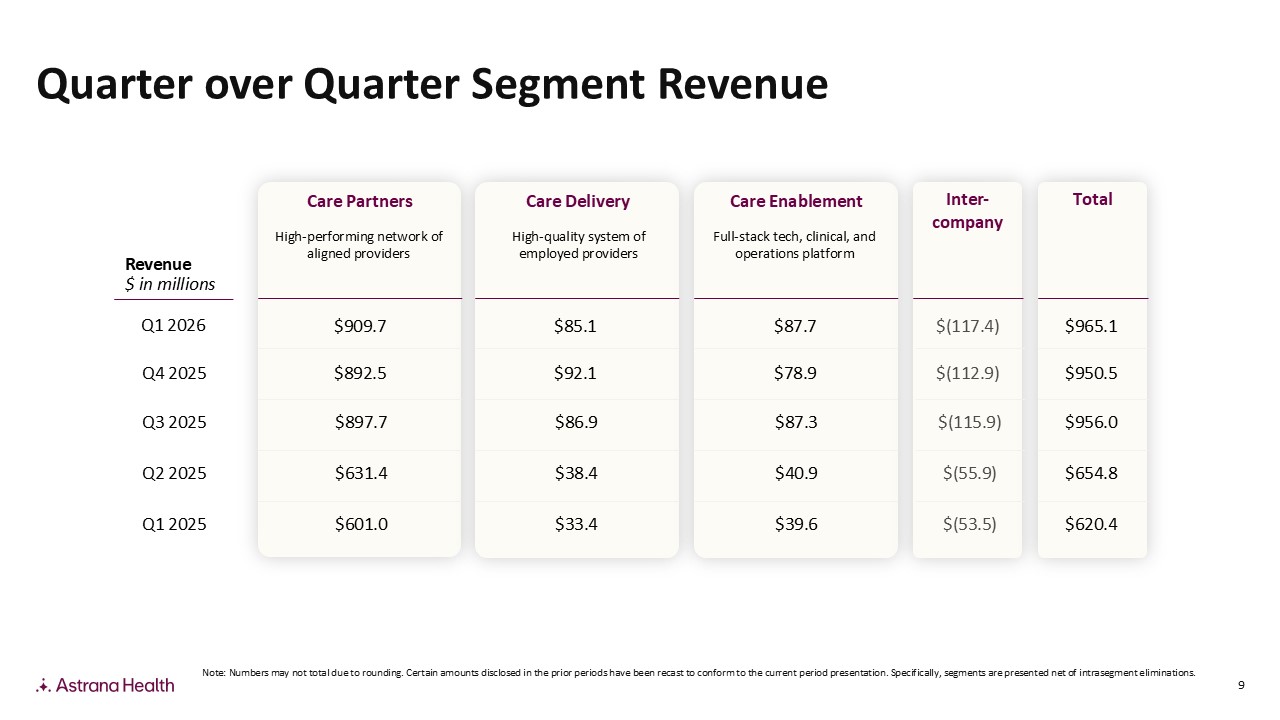
9 Quarter over Quarter Segment Revenue Revenue $ in millions Q1 2025 Q2 2025 Q3 2025 Q4 2025 Care Partners High - performing network of aligned providers $631.4 $897.7 Care Delivery High - quality system of employed providers $33.4 $38.4 $86.9 Care Enablement Full - stack tech, clinical, and operations platform $39.6 $40.9 $87.3 Inter - company $(53.5) $(55.9) $(115.9) Total $620.4 $654.8 $956.0 $892.5 $92.1 $78.9 $(112.9) $950.5 $601.0 Note: Numbers may not total due to rounding. Certain amounts disclosed in the prior periods have been recast to conform to th e c urrent period presentation. Specifically, segments are presented net of intrasegment eliminations. Q1 2026 $909.7 $85.1 $87.7 $(117.4) $965.1AS1AS2

10 Selected Financial Results
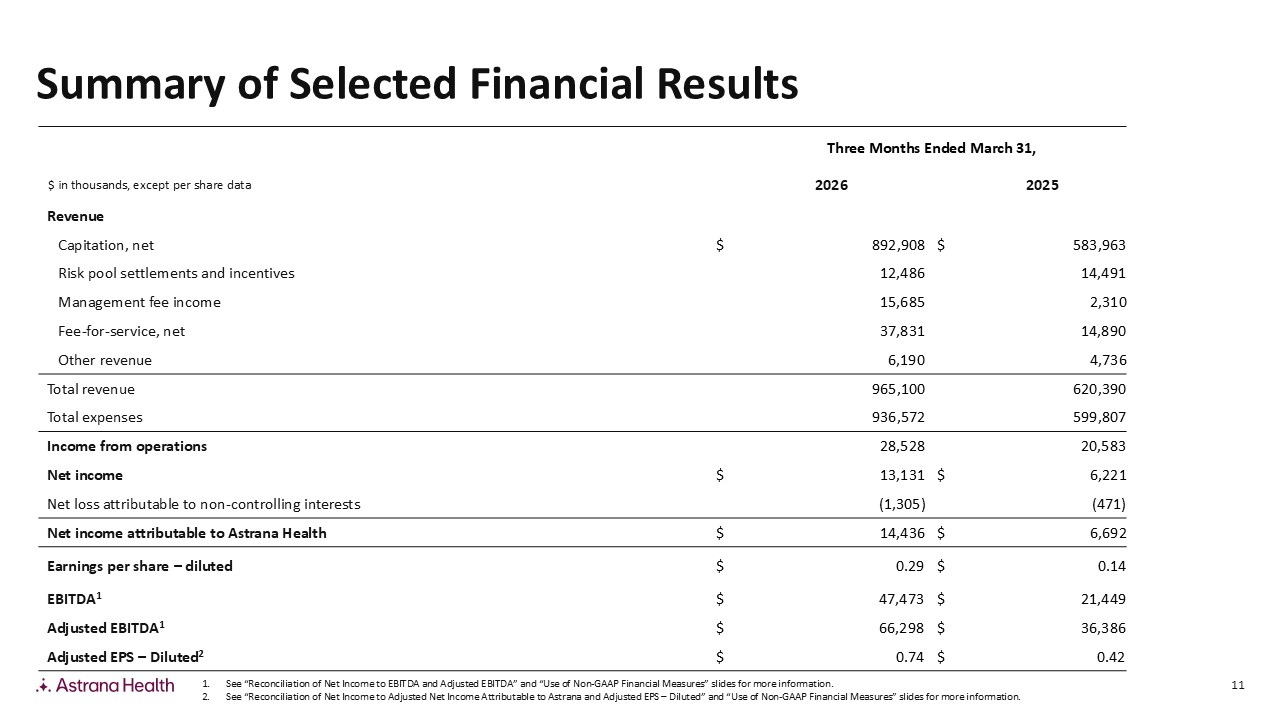
11 Three Months Ended March 31, 2025 2026 $ in thousands, except per share data Revenue 583,963 $ 892,908 $ Capitation, net 14,491 12,486 Risk pool settlements and incentives 2,310 15,685 Management fee income 14,890 37,831 Fee - for - service, net 4,736 6,190 Other revenue 620,390 965,100 Total revenue 599,807 936,572 Total expenses 20,583 28,528 Income from operations 6,221 $ 13,131 $ Net income (471) (1,305) Net loss attributable to non - controlling interests 6,692 $ 14,436 $ Net income attributable to Astrana Health 0.14 $ 0.29 $ Earnings per share – diluted 21,449 $ 47,473 $ EBITDA 1 36,386 $ 66,298 $ Adjusted EBITDA 1 0.42 $ 0.74 $ Adjusted EPS – Diluted 2 Summary of Selected Financial Results 1. See “Reconciliation of Net Income to EBITDA and Adjusted EBITDA” and “Use of Non - GAAP Financial Measures” slides for more inform ation. 2. See “Reconciliation of Net Income to Adjusted Net Income Attributable to Astrana and Adjusted EPS – Diluted” and “Use of Non - GAA P Financial Measures” slides for more information.AS1 JZ2
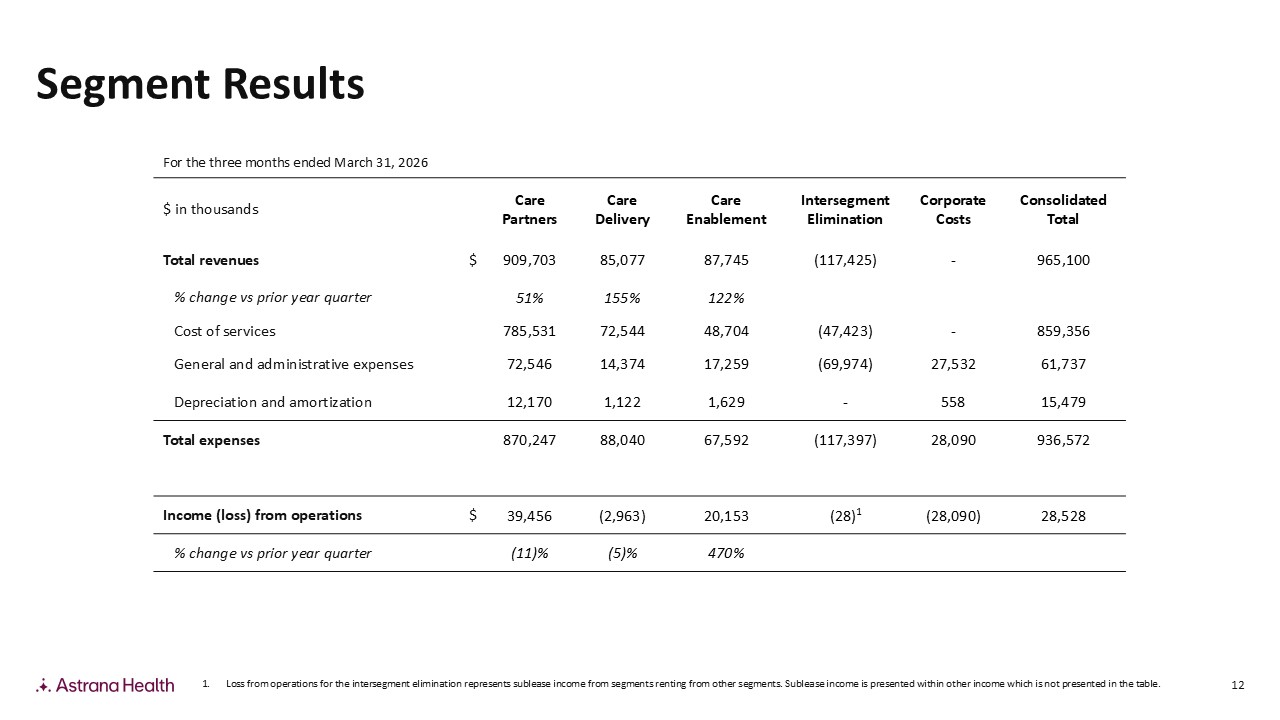
12 Consolidated Total Corporate Costs Intersegment Elimination Care Enablement Care Delivery Care Partners $ in thousands 965,100 - (117,425) 87,745 85,077 909,703 $ Total revenues 122% 155% 51% % change vs prior year quarter 859,356 - (47,423) 48,704 72,544 785,531 Cost of services 61,737 27,532 (69,974) 17,259 14,374 72,546 General and administrative expenses 15,479 558 - 1,629 1,122 12,170 Depreciation and amortization 936,572 28,090 (117,397) 67,592 88,040 870,247 Total expenses 28,528 (28,090) (28) 1 20,153 (2,963) 39,456 $ Income (loss) from operations 470% (5)% (11)% % change vs prior year quarter For the three months ended March 31, 2026 Segment Results 1. Loss from operations for the intersegment elimination represents sublease income from segments renting from other segments. S ubl ease income is presented within other income which is not presented in the table.AS1JZ2DH3AS4
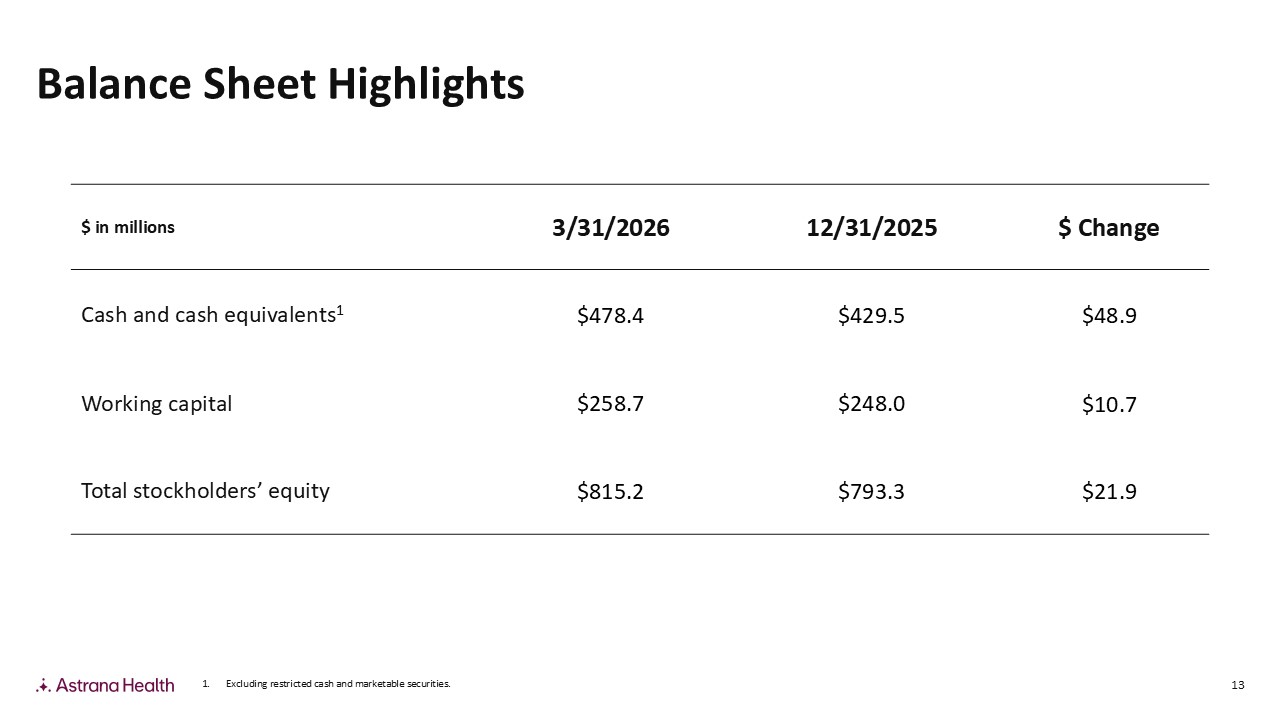
13 $ Change 12/31/2025 3/31/2026 $ in millions $48.9 $429.5 $478.4 Cash and cash equivalents 1 $10.7 $248.0 $258.7 Working capital $21.9 $793.3 $815.2 Total stockholders’ equity Balance Sheet Highlights 1. Excluding restricted cash and marketable securities.AS1 JZ2
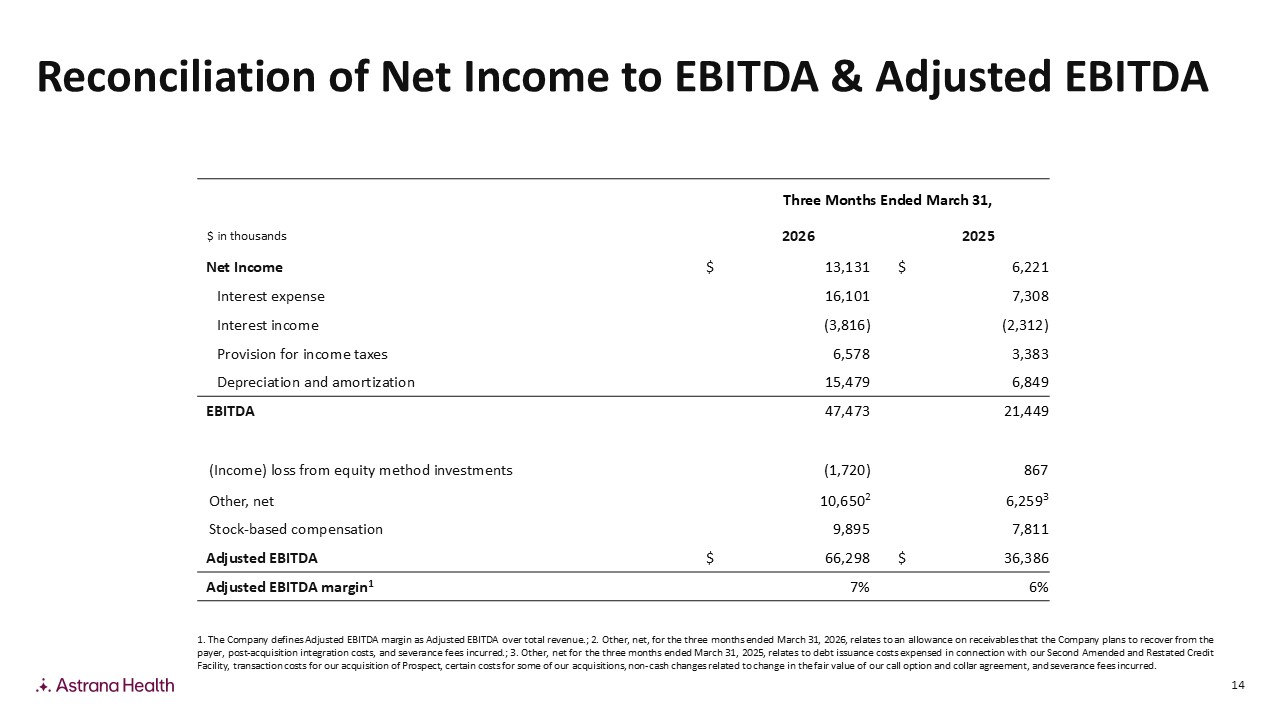
14 1 . The Company defines Adjusted EBITDA margin as Adjusted EBITDA over total revenue .; 2 . Other, net, for the three months ended March 31 , 2026 , relates to an allowance on receivables that the Company plans to recover from the payer, post - acquisition integration costs, and severance fees incurred .; 3 . Other, net for the three months ended March 31 , 2025 , relates to debt issuance costs expensed in connection with our Second Amended and Restated Credit Facility, transaction costs for our acquisition of Prospect, certain costs for some of our acquisitions, non - cash changes related to change in the fair value of our call option and collar agreement, and severance fees incurred . Three Months Ended March 31, 2025 2026 $ in thousands 6,221 $ 13,131 $ Net Income 7,308 16,101 Interest expense (2,312) (3,816) Interest income 3,383 6,578 Provision for income taxes 6,849 15,479 Depreciation and amortization 21,449 47,473 EBITDA 867 (1,720) (Income) loss from equity method investments 6,259 3 10,650 2 Other, net 7,811 9,895 Stock - based compensation 36,386 $ 66,298 $ Adjusted EBITDA 6% 7% Adjusted EBITDA margin 1 Reconciliation of Net Income to EBITDA & Adjusted EBITDAAS1JZ2 JZ3 4
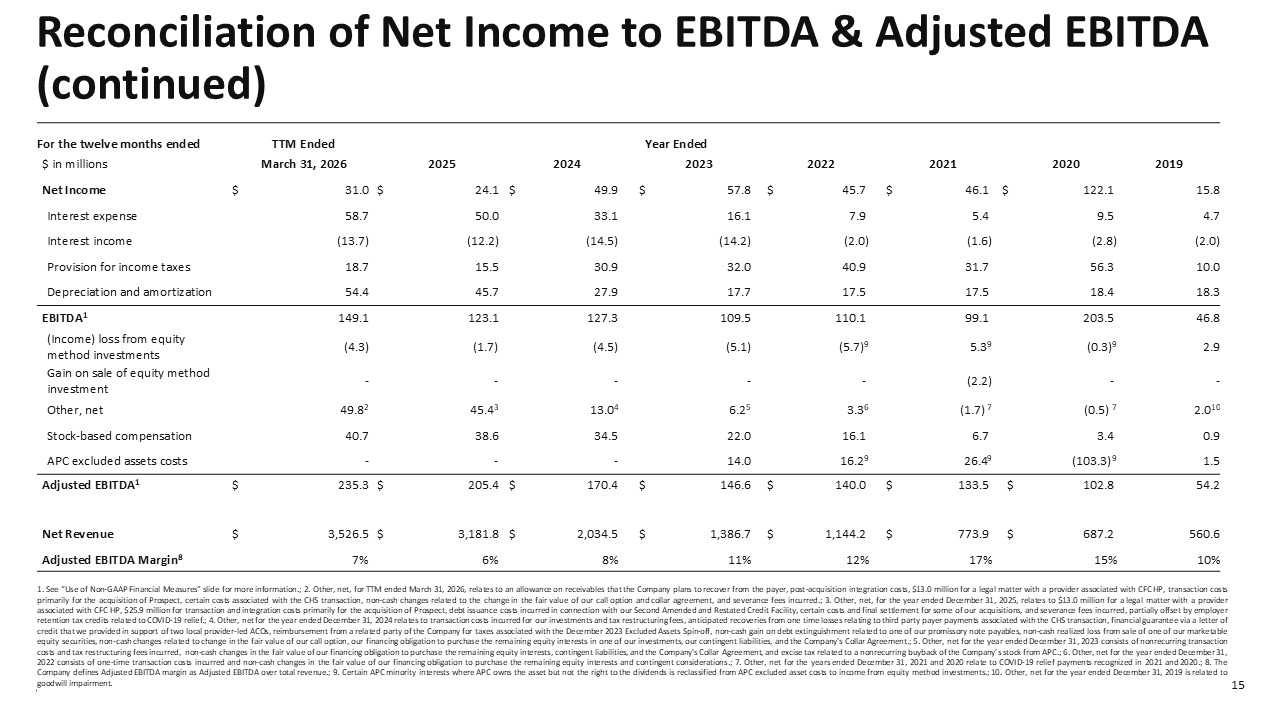
15 Year Ended TTM Ended For the twelve months ended 2019 2020 2021 2022 2023 2024 2025 March 31, 2026 $ in millions 15.8 122.1 $ 46.1 $ 45.7 $ 57.8 $ 49.9 $ 24.1 $ 31.0 $ Net Income 4.7 9.5 5.4 7.9 16.1 33.1 50.0 58.7 Interest expense (2.0) (2.8) (1.6) (2.0) (14.2) (14.5) (12.2) (13.7) Interest income 10.0 56.3 31.7 40.9 32.0 30.9 15.5 18.7 Provision for income taxes 18.3 18.4 17.5 17.5 17.7 27.9 45.7 54.4 Depreciation and amortization 46.8 203.5 99.1 110.1 109.5 127.3 123.1 149.1 EBITDA 1 2.9 (0.3) 9 5.3 9 (5.7) 9 (5.1) (4.5) (1.7) (4.3) (Income) loss from equity method investments - - (2.2) - - - - - Gain on sale of equity method investment 2.0 10 (0.5) 7 (1.7) 7 3.3 6 6.2 5 13.0 4 45.4 3 49.8 2 Other, net 0.9 3.4 6.7 16.1 22.0 34.5 38.6 40.7 Stock - based compensation 1.5 (103.3) 9 26.4 9 16.2 9 14.0 - - - APC excluded assets costs 54.2 102.8 $ 133.5 $ 140.0 $ 146.6 $ 170.4 $ 205.4 $ 235.3 $ Adjusted EBITDA 1 560.6 687.2 $ 773.9 $ 1,144.2 $ 1,386.7 $ 2,034.5 $ 3,181.8 $ 3,526.5 $ Net Revenue 10% 15% 17% 12% 11% 8% 6% 7% Adjusted EBITDA Margin 8 Reconciliation of Net Income to EBITDA & Adjusted EBITDA (continued) 1 . See “Use of Non - GAAP Financial Measures” slide for more information .; 2 . Other, net, for TTM ended March 31 , 2026 , relates to an allowance on receivables that the Company plans to recover from the payer, post - acquisition integration costs, $ 13 . 0 million for a legal matter with a provider associated with CFC HP, transaction costs primarily for the acquisition of Prospect, certain costs associated with the CHS transaction, non - cash changes related to the change in the fair value of our call option and collar agreement, and severance fees incurred .; 3 . Other, net, for the year ended December 31 , 2025 , relates to $ 13 . 0 million for a legal matter with a provider associated with CFC HP, $ 25 . 9 million for transaction and integration costs primarily for the acquisition of Prospect, debt issuance costs incurred in connection with our Second Amended and Restated Credit Facility, certain costs and final settlement for some of our acquisitions, and severance fees incurred, partially offset by employer retention tax credits related to COVID - 19 relief .; 4 . Other, net for the year ended December 31 , 2024 relates to transaction costs incurred for our investments and tax restructuring fees, anticipated recoveries from one time losses relating to third party payer payments associated with the CHS transaction, financial guarantee via a letter of credit that we provided in support of two local provider - led ACOs, reimbursement from a related party of the Company for taxes associated with the December 2023 Excluded Assets Spin - off, non - cash gain on debt extinguishment related to one of our promissory note payables, non - cash realized loss from sale of one of our marketable equity securities, non - cash changes related to change in the fair value of our call option, our financing obligation to purchase the remaining equity interests in one of our investments, our contingent liabilities, and the Company's Collar Agreement .; 5 . Other, net for the year ended December 31 , 2023 consists of nonrecurring transaction costs and tax restructuring fees incurred, non - cash changes in the fair value of our financing obligation to purchase the remaining equity interests, contingent liabilities, and the Company's Collar Agreement, and excise tax related to a nonrecurring buyback of the Company’s stock from APC .; 6 . Other, net for the year ended December 31 , 2022 consists of one - time transaction costs incurred and non - cash changes in the fair value of our financing obligation to purchase the remaining equity interests and contingent considerations .; 7 . Other, net for the years ended December 31 , 2021 and 2020 relate to COVID - 19 relief payments recognized in 2021 and 2020 .; 8 . The Company defines Adjusted EBITDA margin as Adjusted EBITDA over total revenue .; 9 . Certain APC minority interests where APC owns the asset but not the right to the dividends is reclassified from APC excluded asset costs to income from equity method investments .; 10 . Other, net for the year ended December 31 , 2019 is related to goodwill impairment .AS1 RM2 RM3 JZ4 5
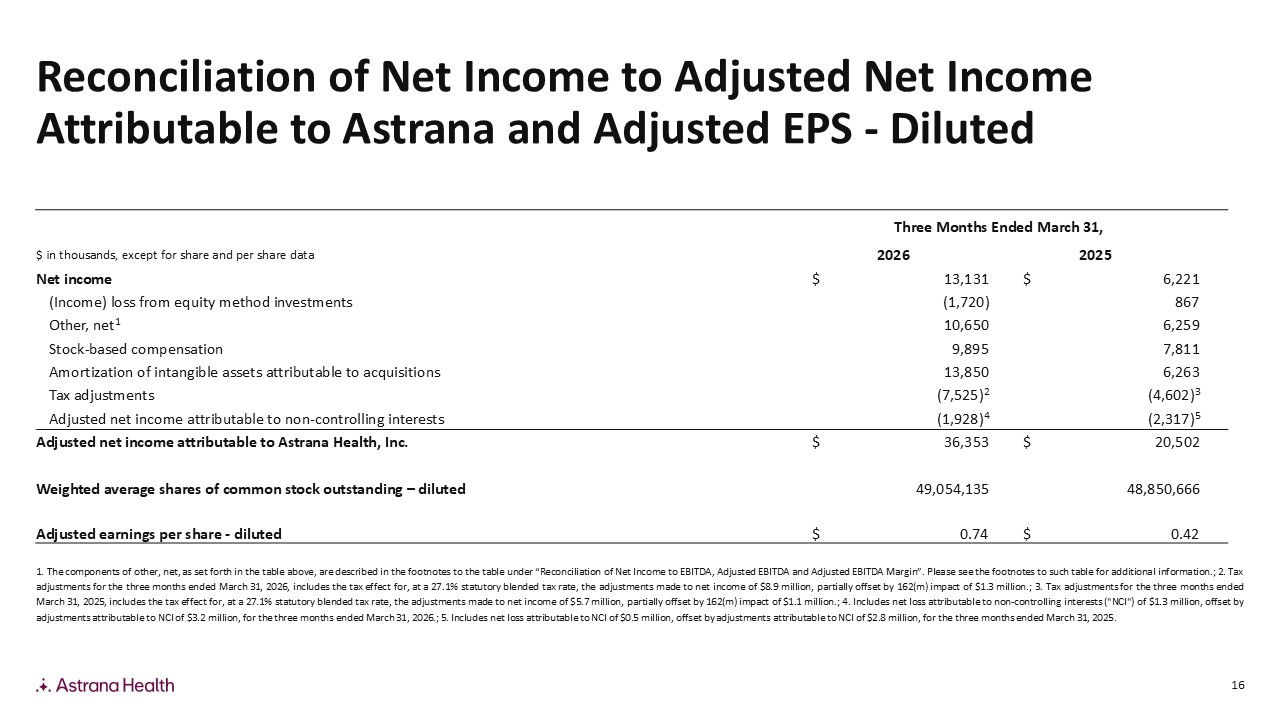
16 Reconciliation of Net Income to Adjusted Net Income Attributable to Astrana and Adjusted EPS - Diluted Three Months Ended March 31, 2025 2026 $ in thousands, except for share and per share data 6,221 $ 13,131 $ Net income 867 (1,720) (Income) loss from equity method investments 6,259 10,650 Other, net 1 7,811 9,895 Stock - based compensation 6,263 13,850 Amortization of intangible assets attributable to acquisitions (4,602) 3 (7,525) 2 Tax adjustments (2,317) 5 (1,928) 4 Adjusted net income attributable to non - controlling interests 20,502 $ 36,353 $ Adjusted net income attributable to Astrana Health, Inc. 48,850,666 49,054,135 Weighted average shares of common stock outstanding – diluted 0.42 $ 0.74 $ Adjusted earnings per share - diluted 1 . The components of other, net, as set forth in the table above, are described in the footnotes to the table under “Reconciliation of Net Income to EBITDA, Adjusted EBITDA and Adjusted EBITDA Margin” . Please see the footnotes to such table for additional information .; 2 . Tax adjustments for the three months ended March 31 , 202 6 , includes the tax effect for, at a 27 . 1 % statutory blended tax rate, the adjustments made to net income of $ 8 . 9 million, partially offset by 162 (m) impact of $ 1 . 3 million .; 3 . Tax adjustments for the three months ended March 31 , 2025 , includes the tax effect for, at a 27 . 1 % statutory blended tax rate, the adjustments made to net income of $ 5 . 7 million, partially offset by 162 (m) impact of $ 1 . 1 million .; 4 . Includes net loss attributable to non - controlling interests ("NCI") of $ 1 . 3 million, offset by adjustments attributable to NCI of $ 3 . 2 million, for the three months ended March 31 , 2026 .; 5 . Includes net loss attributable to NCI of $ 0 . 5 million, offset by adjustments attributable to NCI of $ 2 . 8 million, for the three months ended March 31 , 2025 .AS1 JZ2 3 4
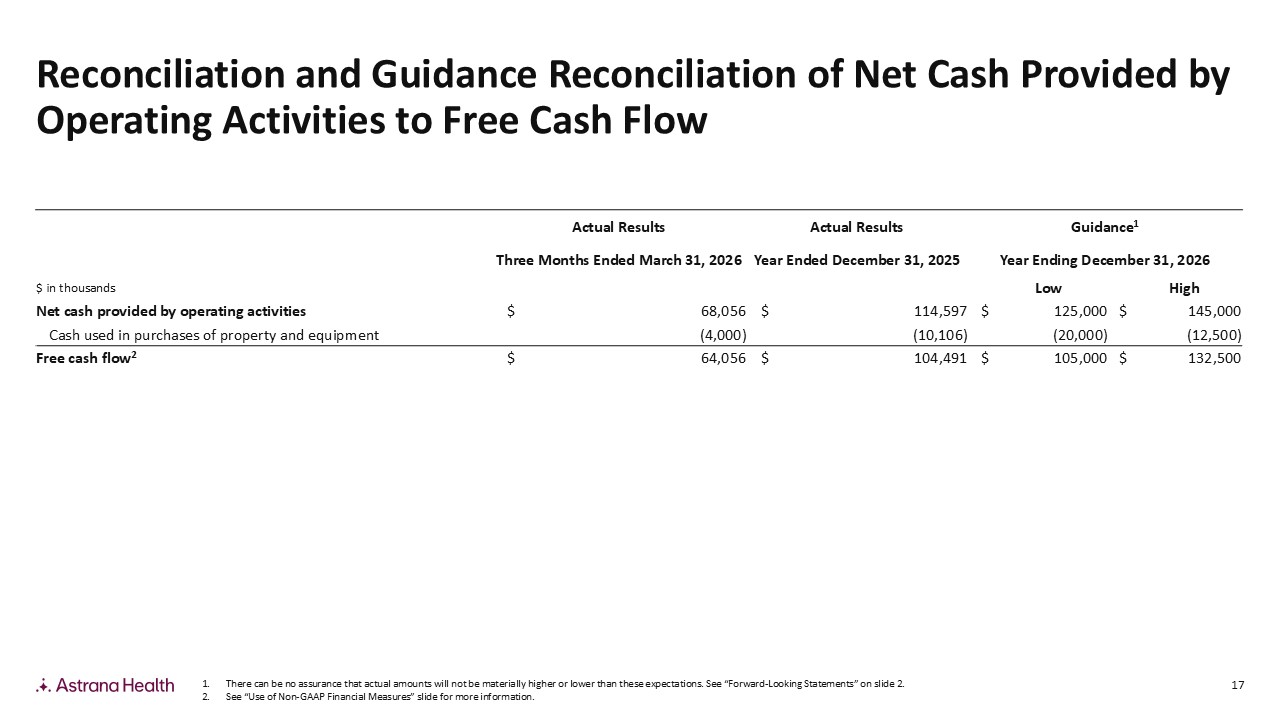
17 Guidance 1 Actual Results Actual Results Year Ending December 31, 2026 Year Ended December 31, 2025 Three Months Ended March 31, 2026 High Low $ in thousands 145,000 $ 125,000 $ 114,597 $ 68,056 $ Net cash provided by operating activities (12,500) (20,000) (10,106) (4,000) Cash used in purchases of property and equipment 132,500 $ 105,000 $ 104,491 $ 64,056 $ Free cash flow 2 1. There can be no assurance that actual amounts will not be materially higher or lower than these expectations. See “Forward - Looki ng Statements” on slide 2. 2. See “Use of Non - GAAP Financial Measures” slide for more information. Reconciliation and Guidance Reconciliation of Net Cash Provided by Operating Activities to Free Cash FlowAS1
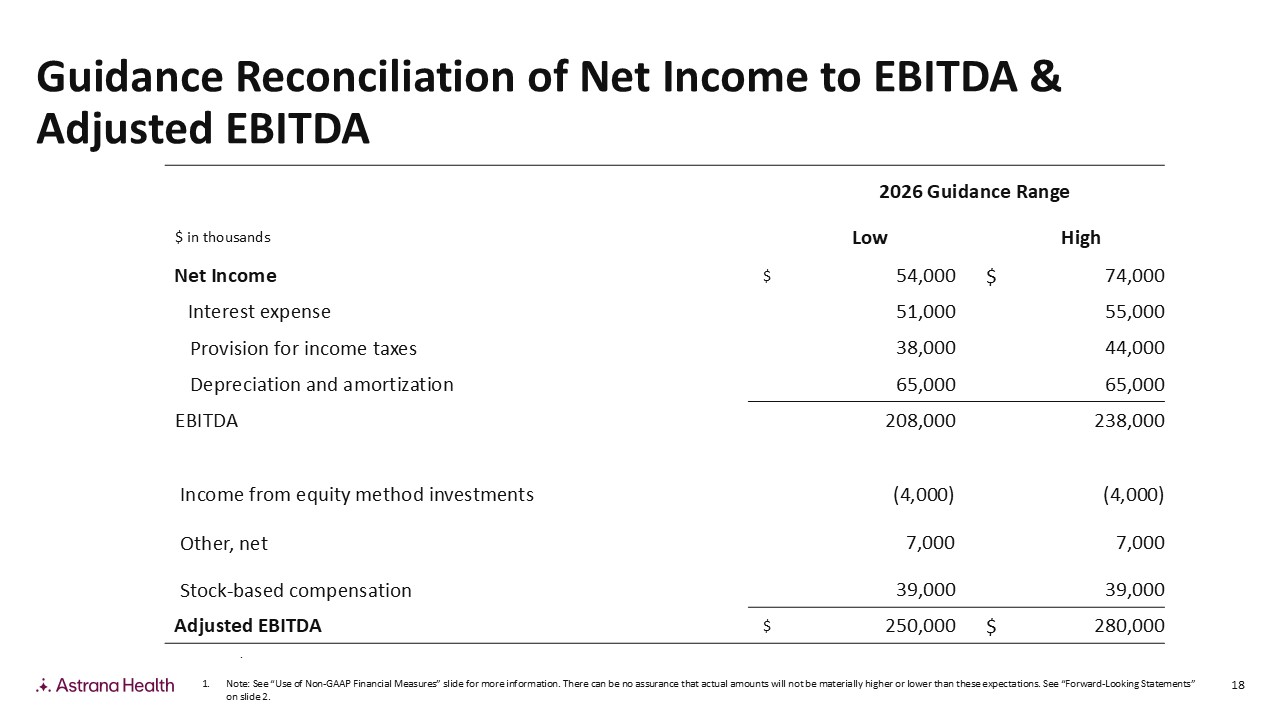
18 . Guidance Reconciliation of Net Income to EBITDA & Adjusted EBITDA 1. Note: See “Use of Non - GAAP Financial Measures” slide for more information. There can be no assurance that actual amounts will not be materially higher or lower than these expectations. See “Forward - Looki ng Statements” on slide 2. 2026 Guidance Range High Low $ in thousands 74,000 $ 54,000 $ Net Income 55,000 51,000 Interest expense 44,000 38,000 Provision for income taxes 65,000 65,000 Depreciation and amortization 238,000 208,000 EBITDA (4,000) (4,000) Income from equity method investments 7,000 7,000 Other, net 39,000 39,000 Stock - based compensation 280,000 $ 250,000 $ Adjusted EBITDAAS1

Investor Relations Carolyne Sohn investors@astranahealth.com