EXHIBIT 99.1
Published on September 10, 2020
Investor Presentation September 2020
Forward Looking Statements This presentation contains forward-looking statements within the meaning of the Private Securities Litigation Reform Act of 1995, Section 27A of the Securities Act and Section 21E of the Exchange Act. Forward-looking statements include any statements about the Company's business, financial condition, operating results, plans, objectives, expectations and intentions, and any projections of earnings, revenue or other financial items, such as the Company's projected capitation and future liquidity, and may be identified by the use of forward-looking terms such as “anticipate,” “could,” “can,” “may,” “might,” “potential,” “predict,” “should,” “estimate,” “expect,” “project,” “believe,” “plan,” “envision,” “intend,” “continue,” “target,” “seek,” “will,” “would,” and the negative of such terms, other variations on such terms or other similar or comparable words, phrases or terminology. Forward-looking statements reflect current views with respect to future events and financial performance and therefore cannot be guaranteed. Such statements are based on the current expectations and certain assumptions of the Company's management, and some or all of such expectations and assumptions may not materialize or may vary significantly from actual results. Actual results may also vary materially from forward-looking statements due to risks, uncertainties and other factors, known and unknown, including the risk factors described from time to time in the Company's reports to the U.S. Securities and Exchange Commission (the “SEC”), including without limitation the risk factors discussed in the Company's Annual Report on Form 10-K filed with the SEC on March 16, 2020 and subsequent Quarterly Reports on Form 10-Q. Because the factors referred to above could cause actual results or outcomes to differ materially from those expressed or implied in any forward-looking statements, you should not place undue reliance on any such forward-looking statements. Any forward-looking statements speak only as of the date of this presentation and, unless legally required, the Company does not undertake any obligation to update any forward-looking statement, as a result of new information, future events or otherwise. 2
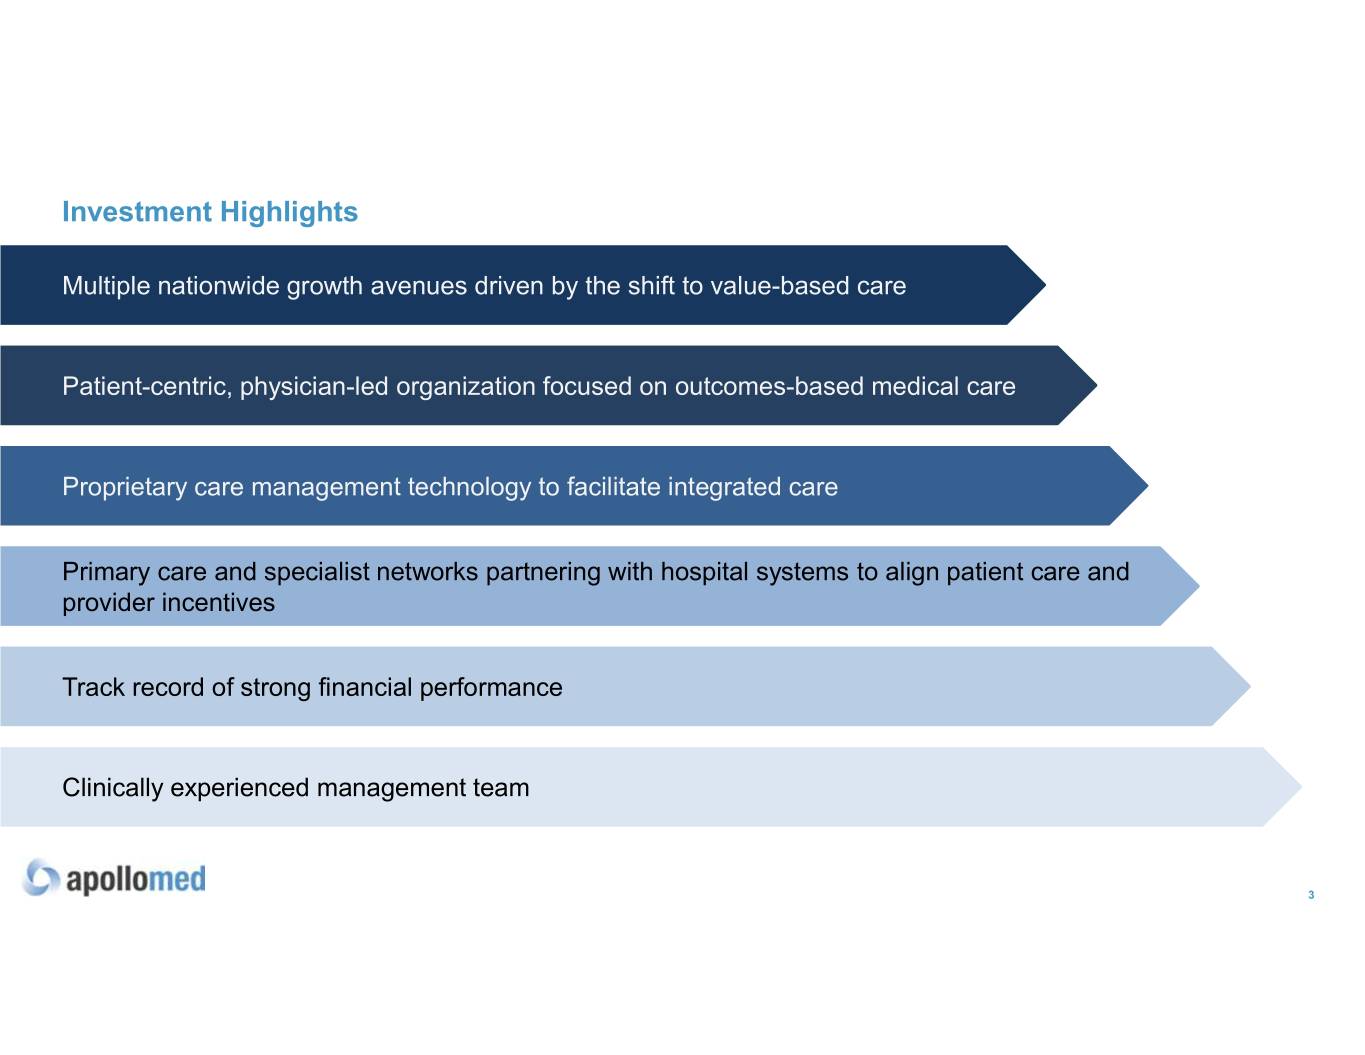
Investment Highlights Multiple nationwide growth avenues driven by the shift to value-based care Patient-centric, physician-led organization focused on outcomes-based medical care Proprietary care management technology to facilitate integrated care Primary care and specialist networks partnering with hospital systems to align patient care and provider incentives Track record of strong financial performance Clinically experienced management team 3

Company Overview 4
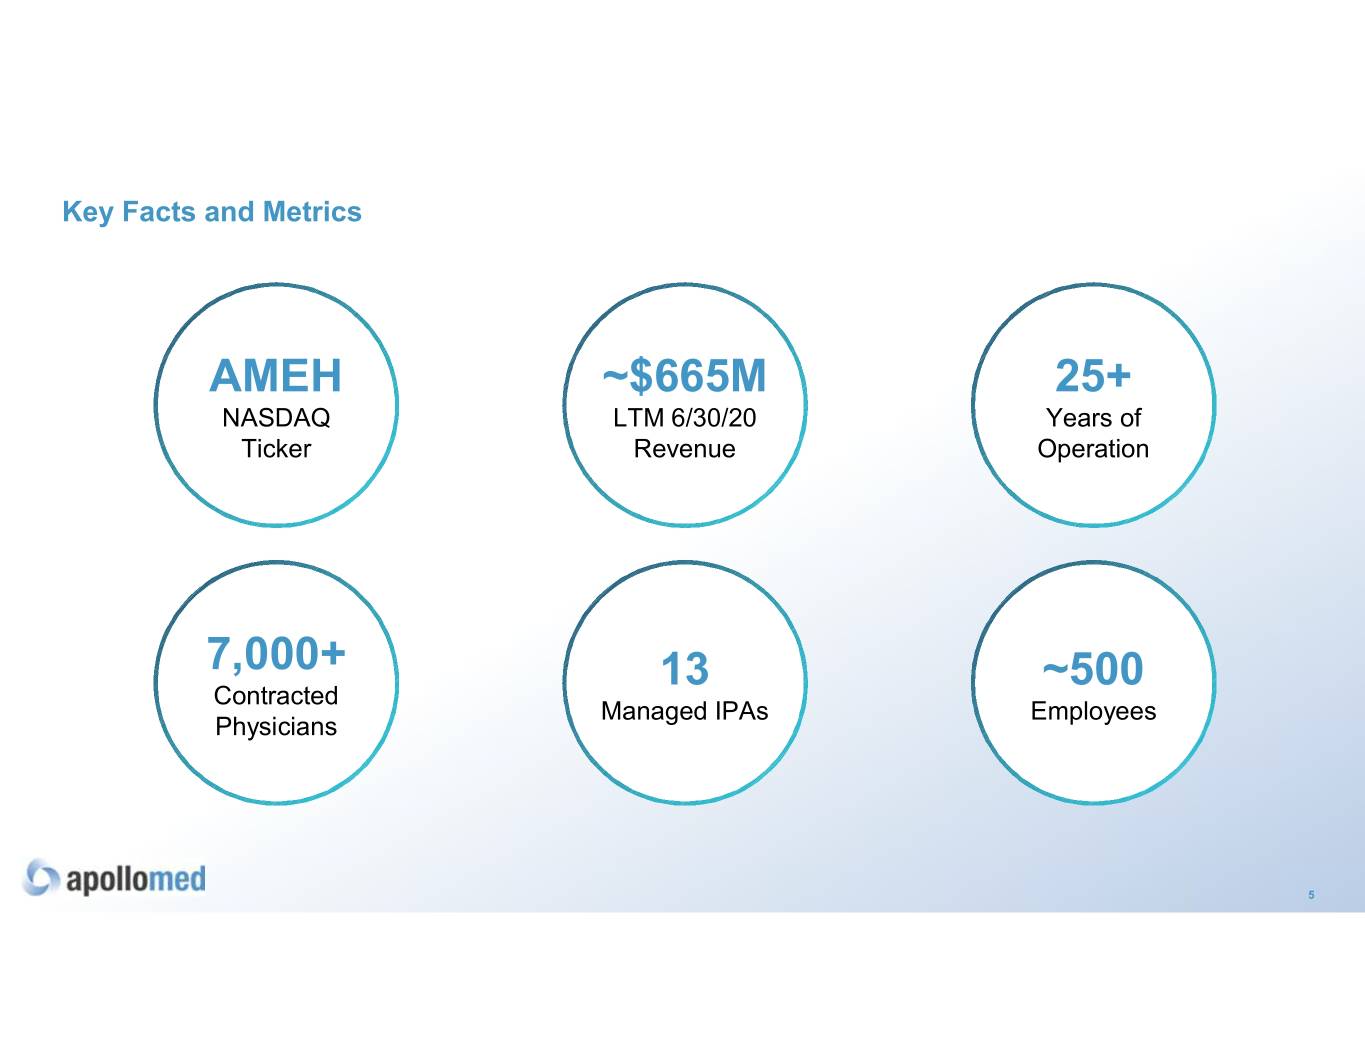
Key Facts and Metrics AMEH ~$665M 25+ NASDAQ LTM 6/30/20 Years of Ticker Revenue Operation 7,000+ 13 ~500 Contracted Managed IPAs Employees Physicians 5
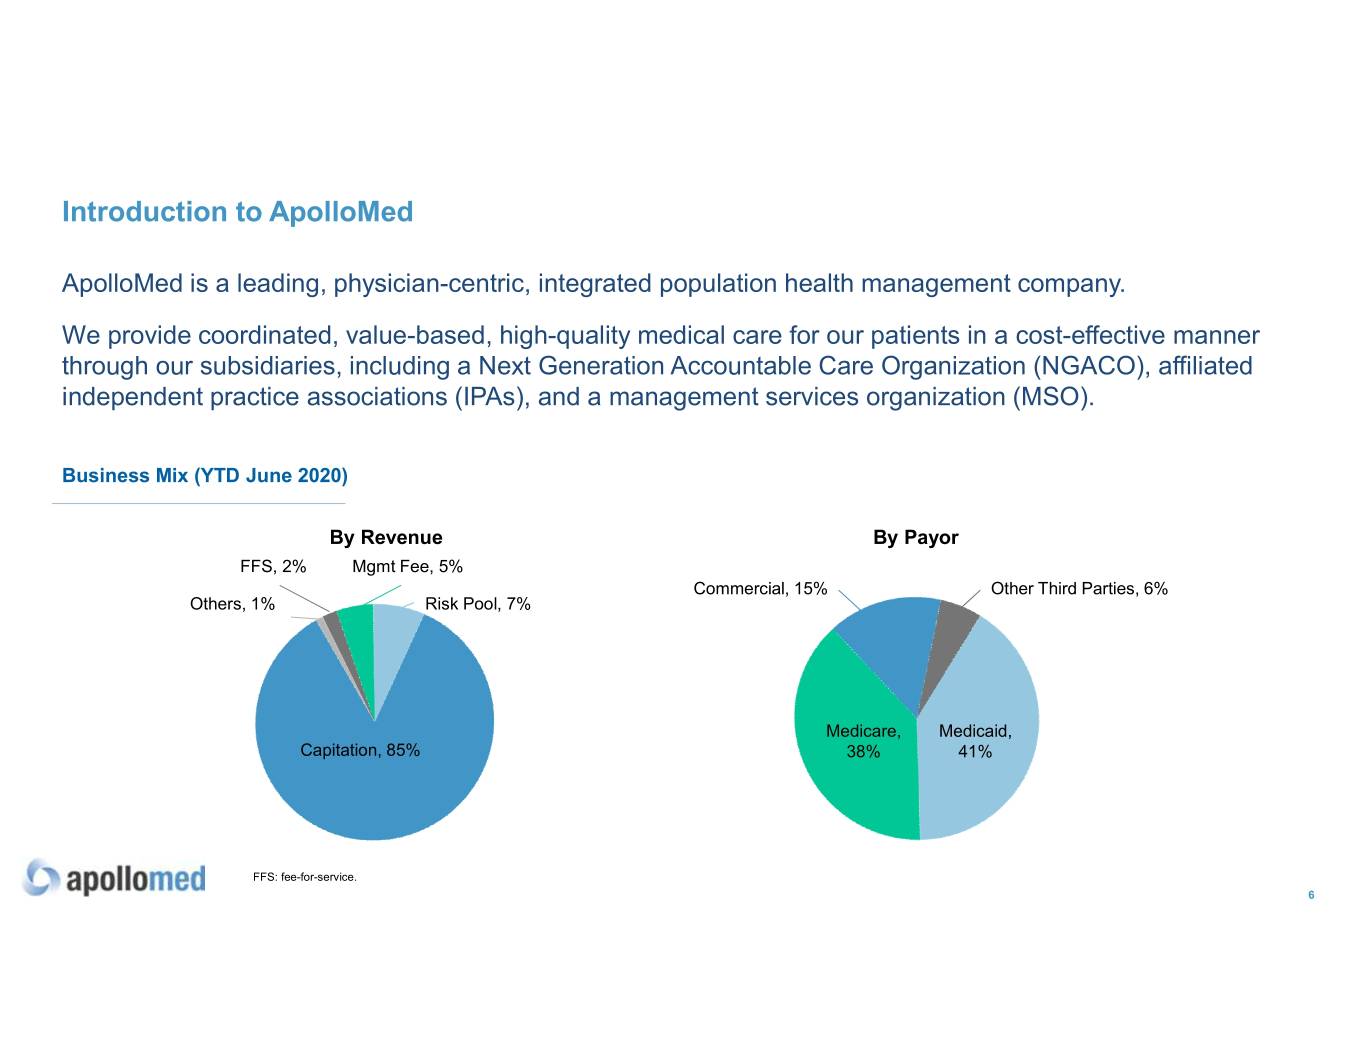
Introduction to ApolloMed ApolloMed is a leading, physician-centric, integrated population health management company. We provide coordinated, value-based, high-quality medical care for our patients in a cost-effective manner through our subsidiaries, including a Next Generation Accountable Care Organization (NGACO), affiliated independent practice associations (IPAs), and a management services organization (MSO). Business Mix (YTD June 2020) By Revenue By Payor FFS, 2% Mgmt Fee, 5% Commercial, 15% Other Third Parties, 6% Others, 1% Risk Pool, 7% Medicare, Medicaid, Capitation, 85% 38% 41% FFS: fee-for-service. 6
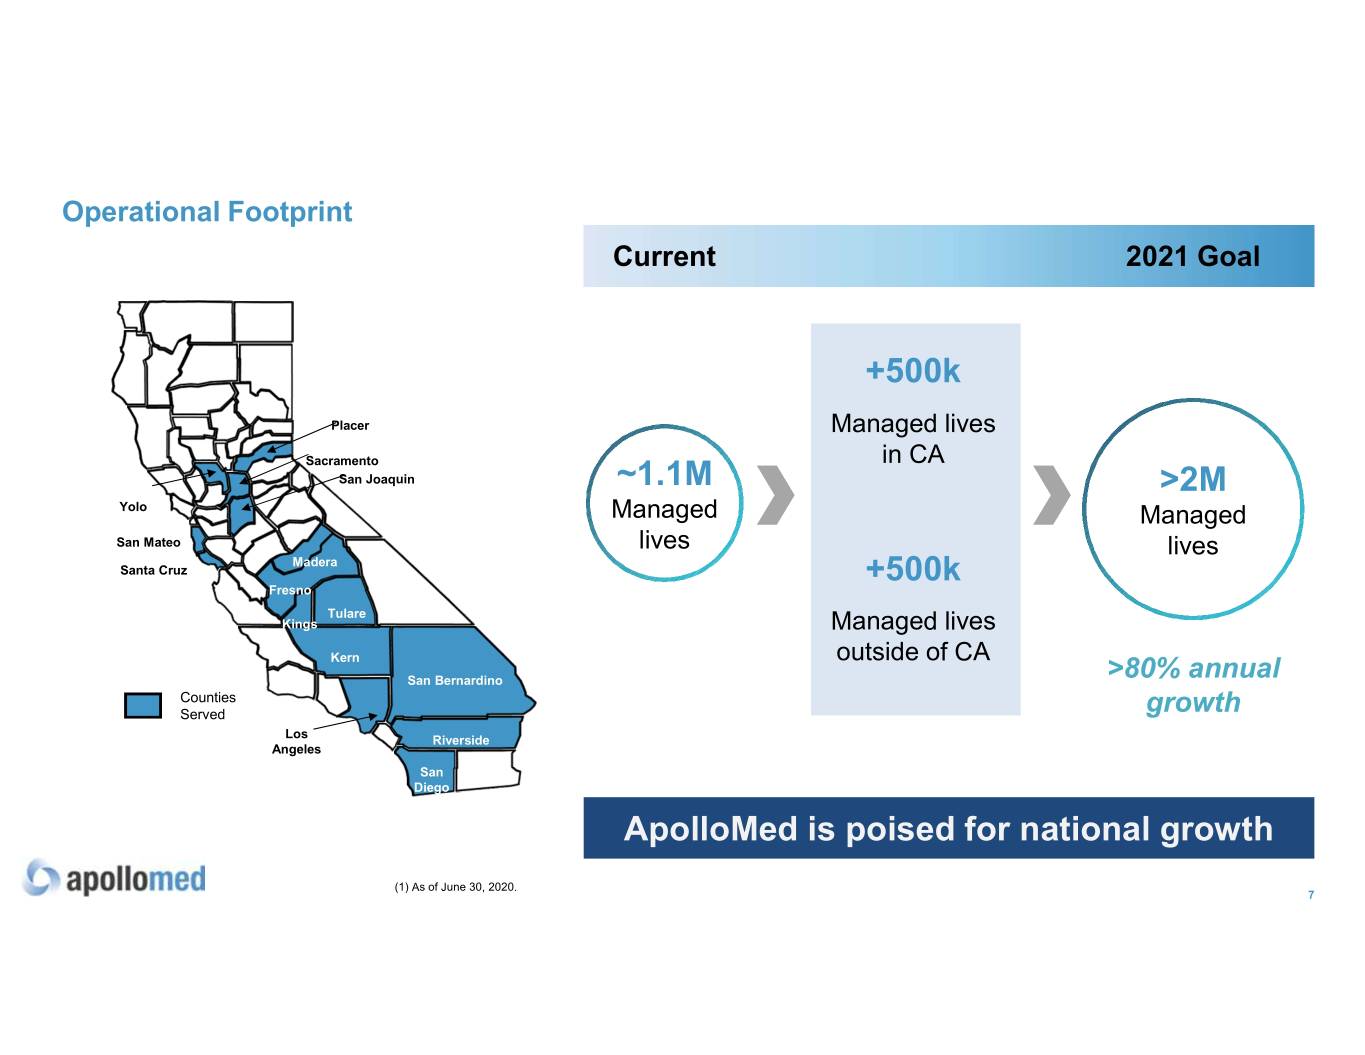
Operational Footprint Current 2021 Goal +500k Placer Managed lives Sacramento in CA San Joaquin ~1.1M >2M Yolo Managed Managed San Mateo lives lives Madera Santa Cruz +500k Fresno Tulare Kings Managed lives Kern outside of CA San Bernardino >80% annual Counties Served growth Los Riverside Angeles San Diego ApolloMed is poised for national growth (1) As of June 30, 2020. 7
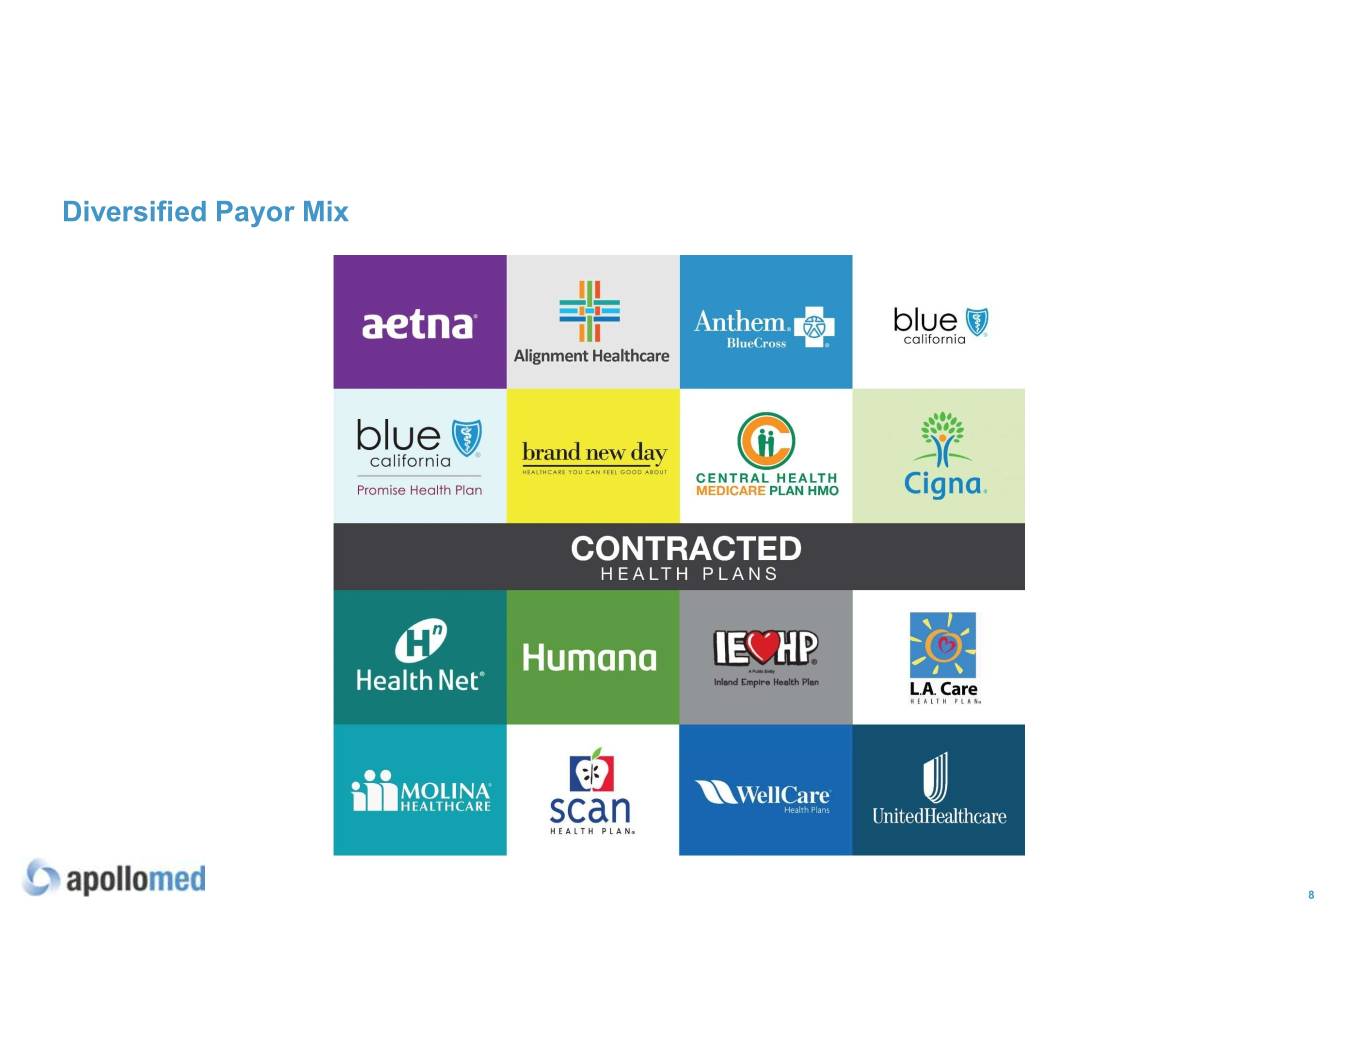
Diversified Payor Mix 8
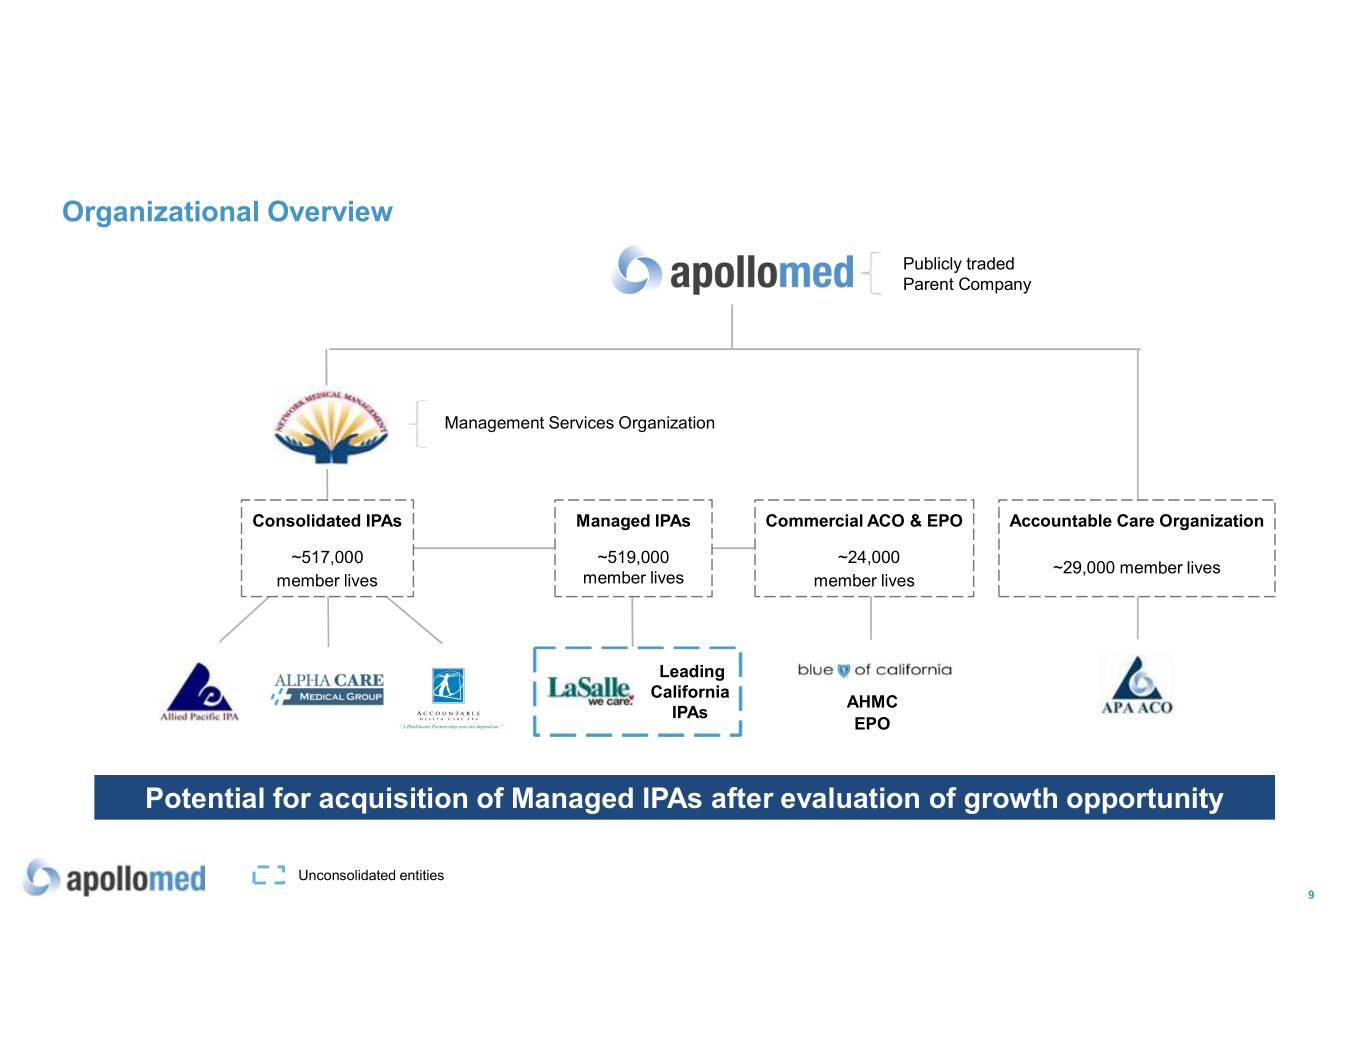
Organizational Overview Publicly traded Parent Company Management Services Organization Consolidated IPAs Managed IPAs Commercial ACO & EPO Accountable Care Organization ~517,000 ~519,000 ~24,000 ~29,000 member lives member lives member lives member lives Leading California AHMC IPAs EPO Potential for acquisition of Managed IPAs after evaluation of growth opportunity Unconsolidated entities 9
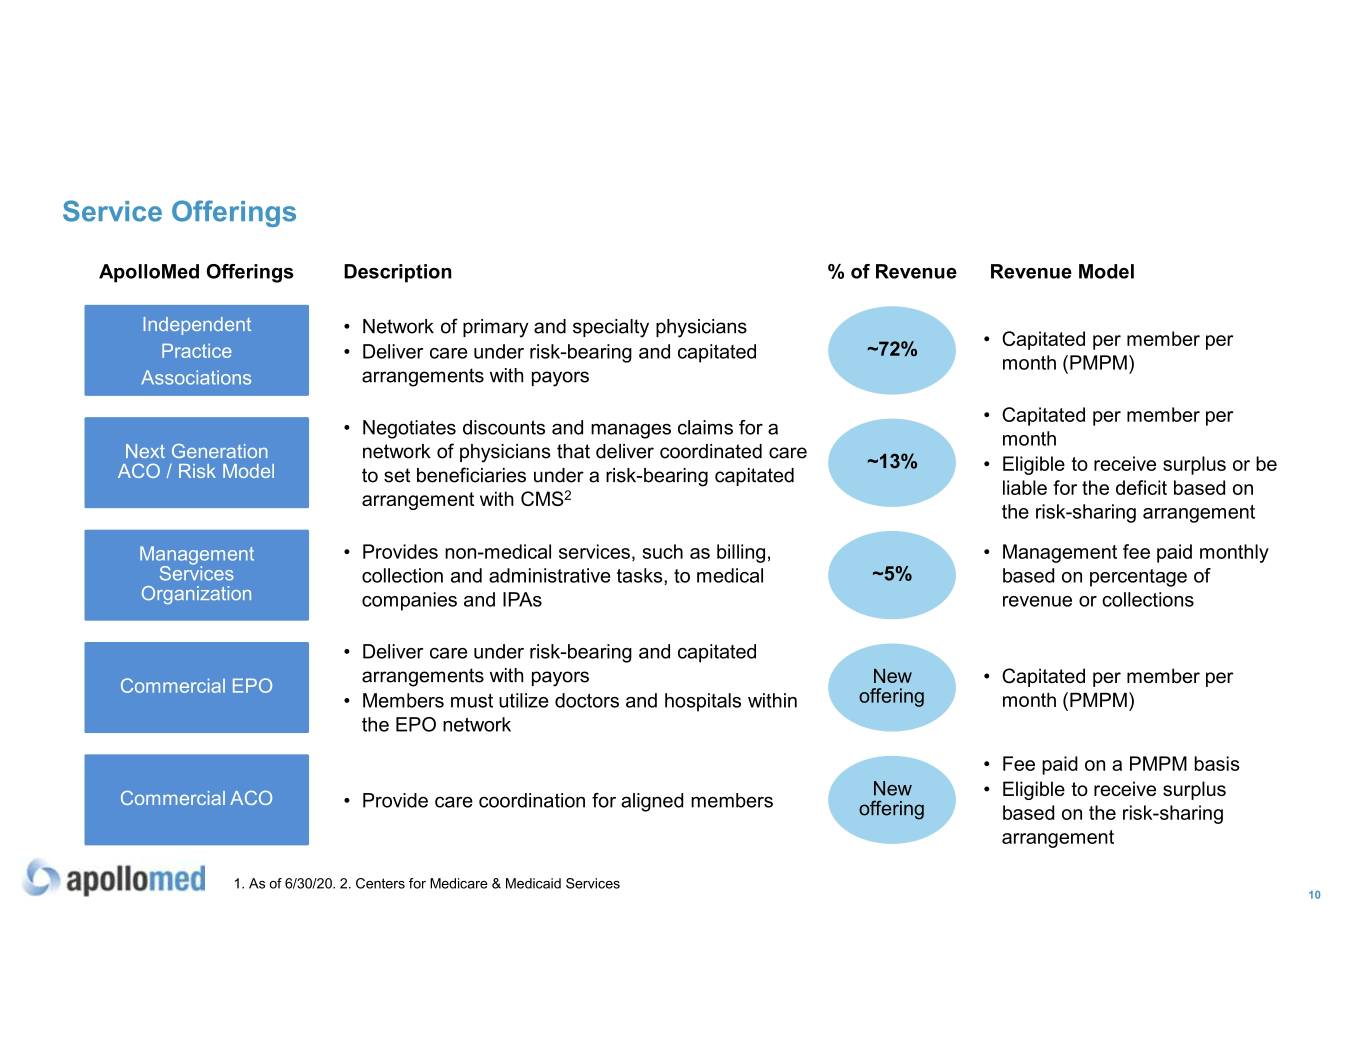
Service Offerings ApolloMed Offerings Description% of Revenue Revenue Model Independent • Network of primary and specialty physicians • Capitated per member per Practice • Deliver care under risk-bearing and capitated ~72% month (PMPM) Associations arrangements with payors • Capitated per member per • Negotiates discounts and manages claims for a month Next Generation network of physicians that deliver coordinated care ~13% • Eligible to receive surplus or be ACO / Risk Model to set beneficiaries under a risk-bearing capitated liable for the deficit based on arrangement with CMS2 the risk-sharing arrangement Management • Provides non-medical services, such as billing, • Management fee paid monthly Services collection and administrative tasks, to medical ~5% based on percentage of Organization companies and IPAs revenue or collections • Deliver care under risk-bearing and capitated arrangements with payors New Commercial EPO • Capitated per member per • Members must utilize doctors and hospitals within offering month (PMPM) the EPO network • Fee paid on a PMPM basis New • Eligible to receive surplus Commercial ACO • Provide care coordination for aligned members offering based on the risk-sharing arrangement 1. As of 6/30/20. 2. Centers for Medicare & Medicaid Services 10
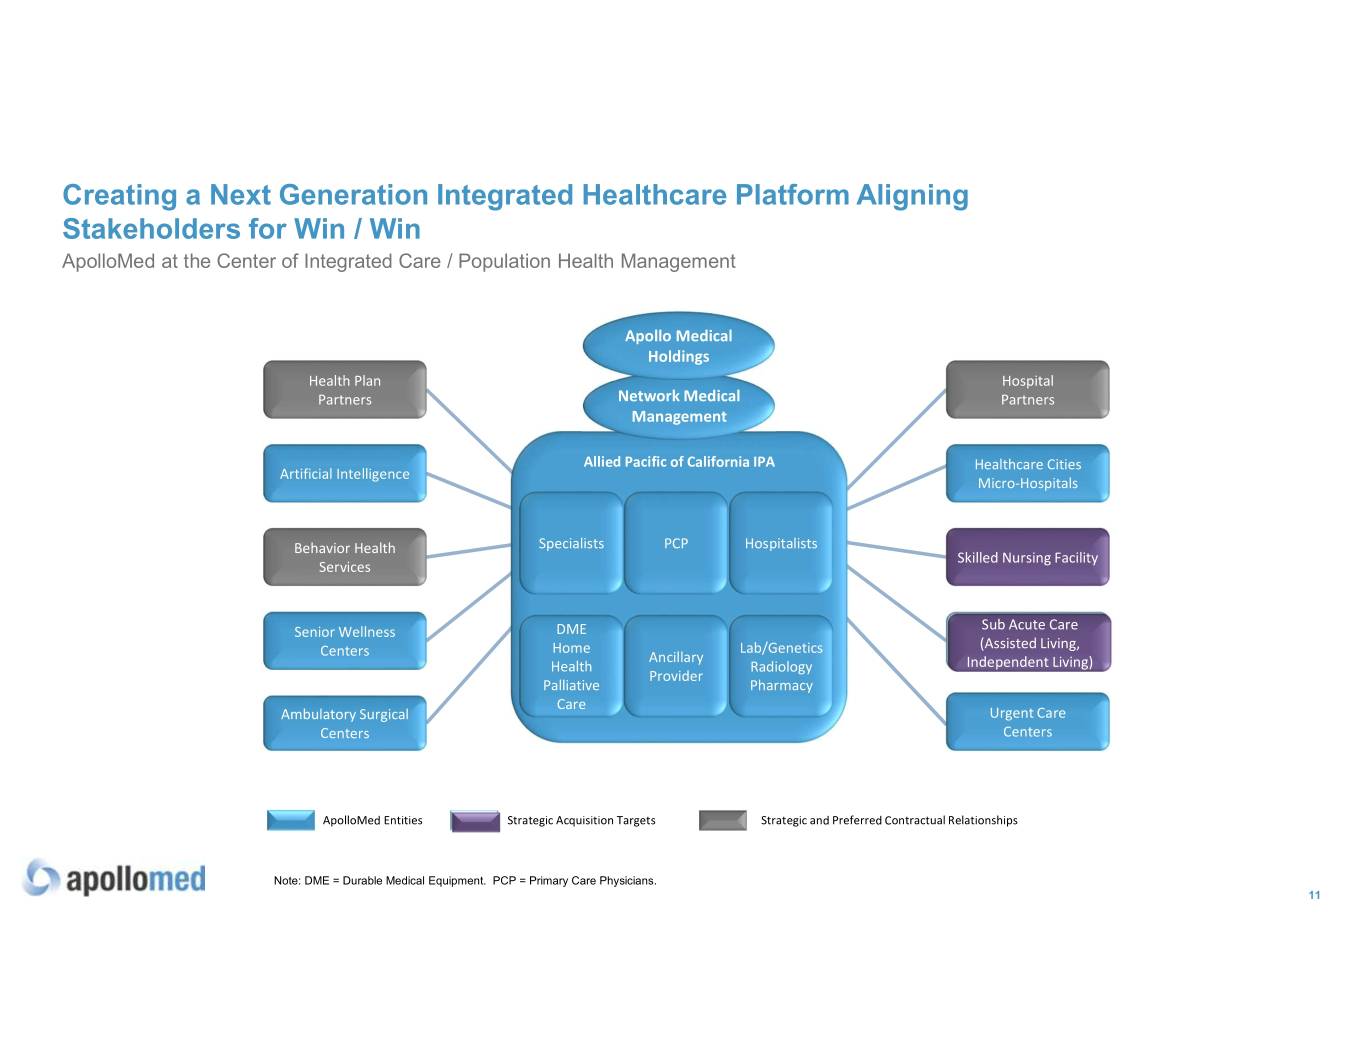
Creating a Next Generation Integrated Healthcare Platform Aligning Stakeholders for Win / Win ApolloMed at the Center of Integrated Care / Population Health Management Apollo Medical Holdings Health Plan Hospital Partners Network Medical Partners Management Allied Pacific of California IPA Healthcare Cities Artificial Intelligence Micro-Hospitals Behavior Health Specialists PCP Hospitalists Skilled Nursing Facility Services Sub Acute Care Senior Wellness DME Sub Acute Care Home Lab/Genetics (Assisted(Assisted Living,Living, Centers Ancillary Health Radiology IndependentIndependent Living)Living) Provider Palliative Pharmacy Care Ambulatory Surgical Urgent Care Centers Centers ApolloMed Entities Strategic Acquisition Targets Strategic and Preferred Contractual Relationships Note: DME = Durable Medical Equipment. PCP = Primary Care Physicians. 11
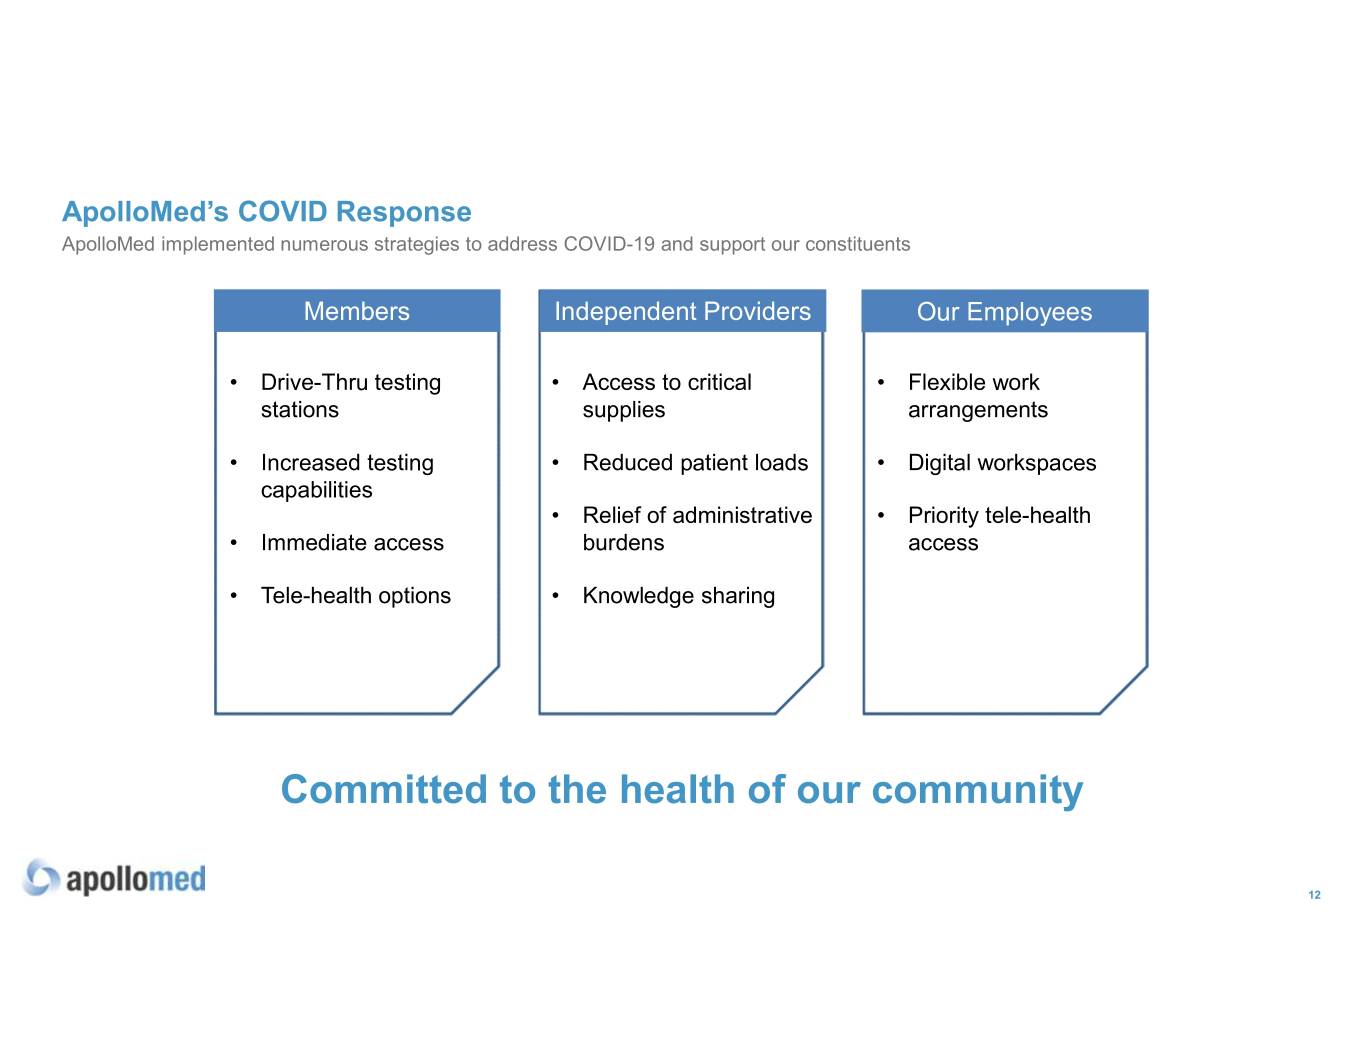
ApolloMed’s COVID Response ApolloMed implemented numerous strategies to address COVID-19 and support our constituents Members Independent Providers Our Employees • Drive-Thru testing • Access to critical • Flexible work stations supplies arrangements • Increased testing • Reduced patient loads • Digital workspaces capabilities • Relief of administrative • Priority tele-health • Immediate access burdens access • Tele-health options • Knowledge sharing Committed to the health of our community 12

Technology Solutions 13
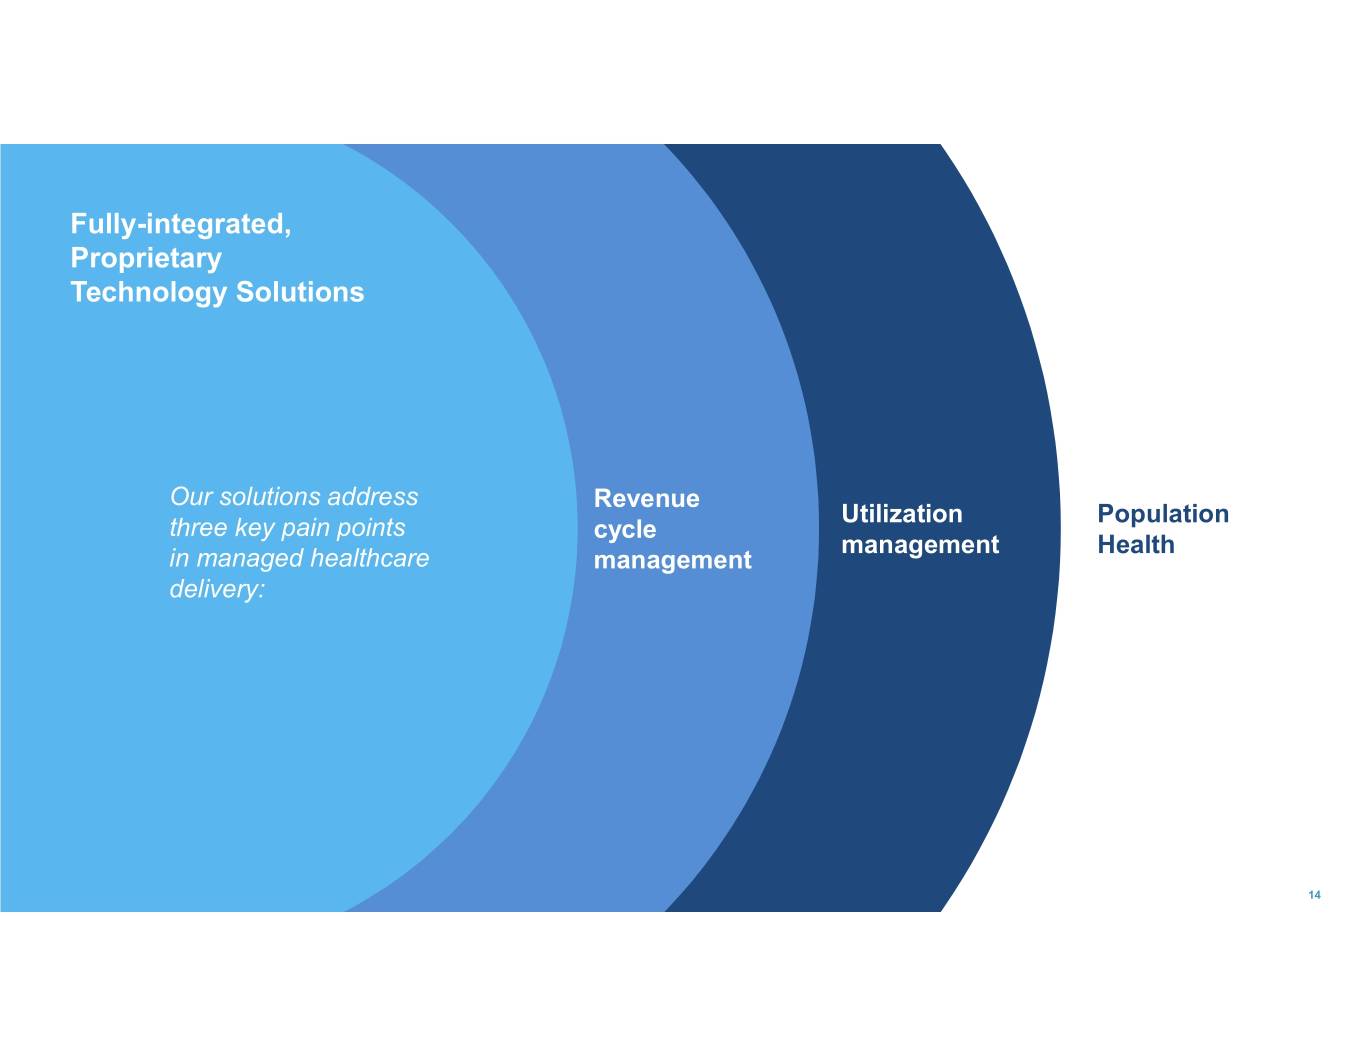
Fully-integrated, Proprietary Technology Solutions Our solutions address Revenue Utilization Population three key pain points cycle management Health in managed healthcare management delivery: 14
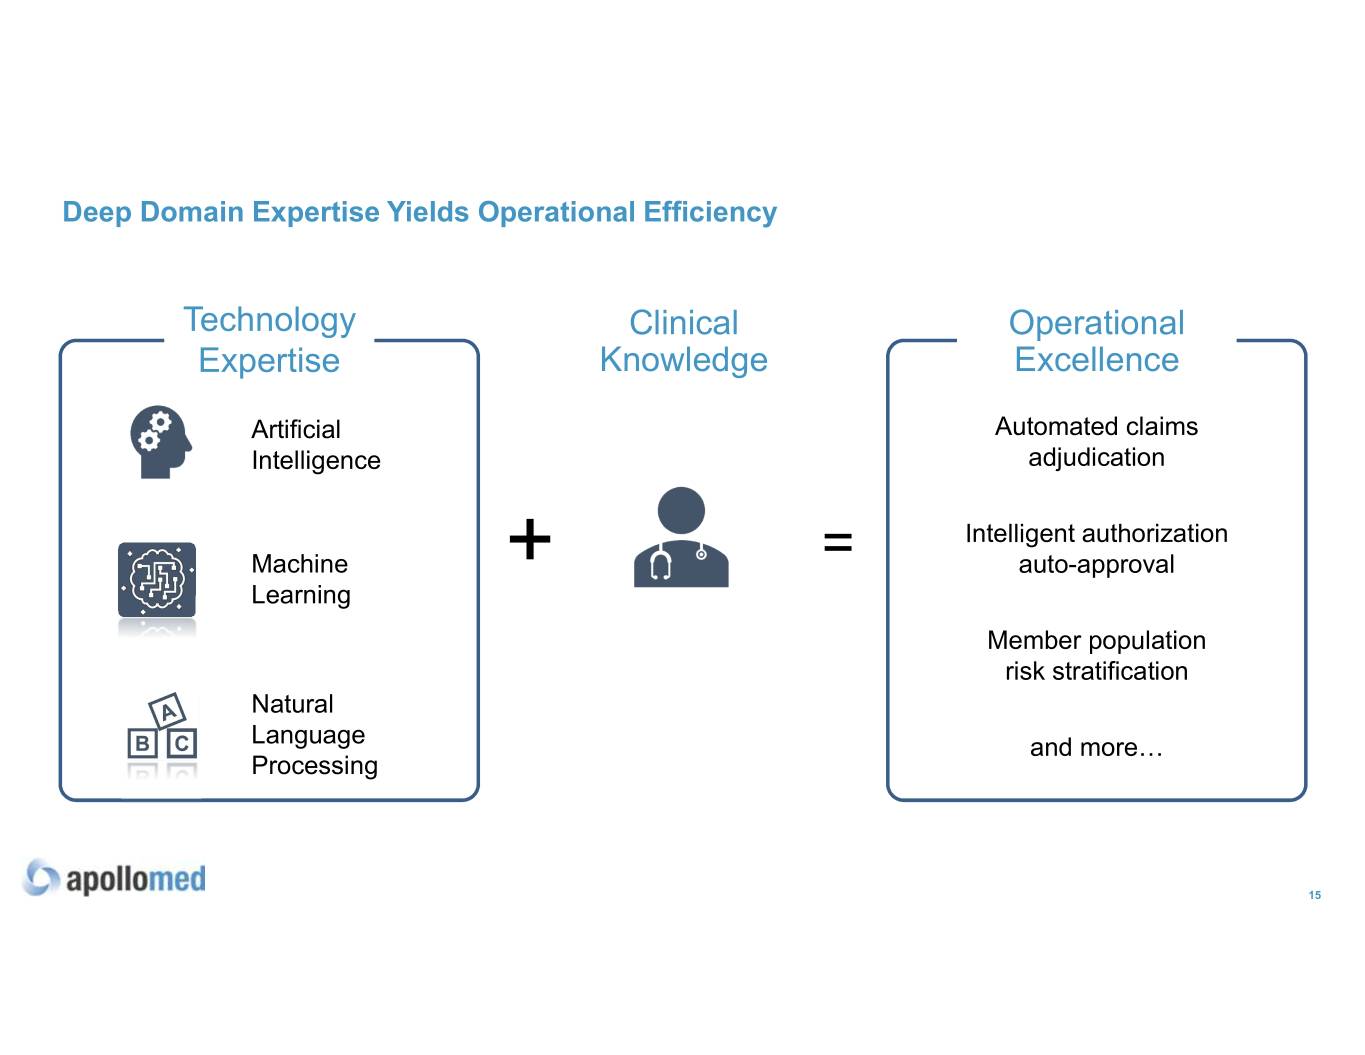
Deep Domain Expertise Yields Operational Efficiency Technology Clinical Operational Expertise Knowledge Excellence Artificial Automated claims Intelligence adjudication Intelligent authorization Machine + = auto-approval Learning Member population risk stratification Natural Language and more… Processing 15

Growth Opportunities 16
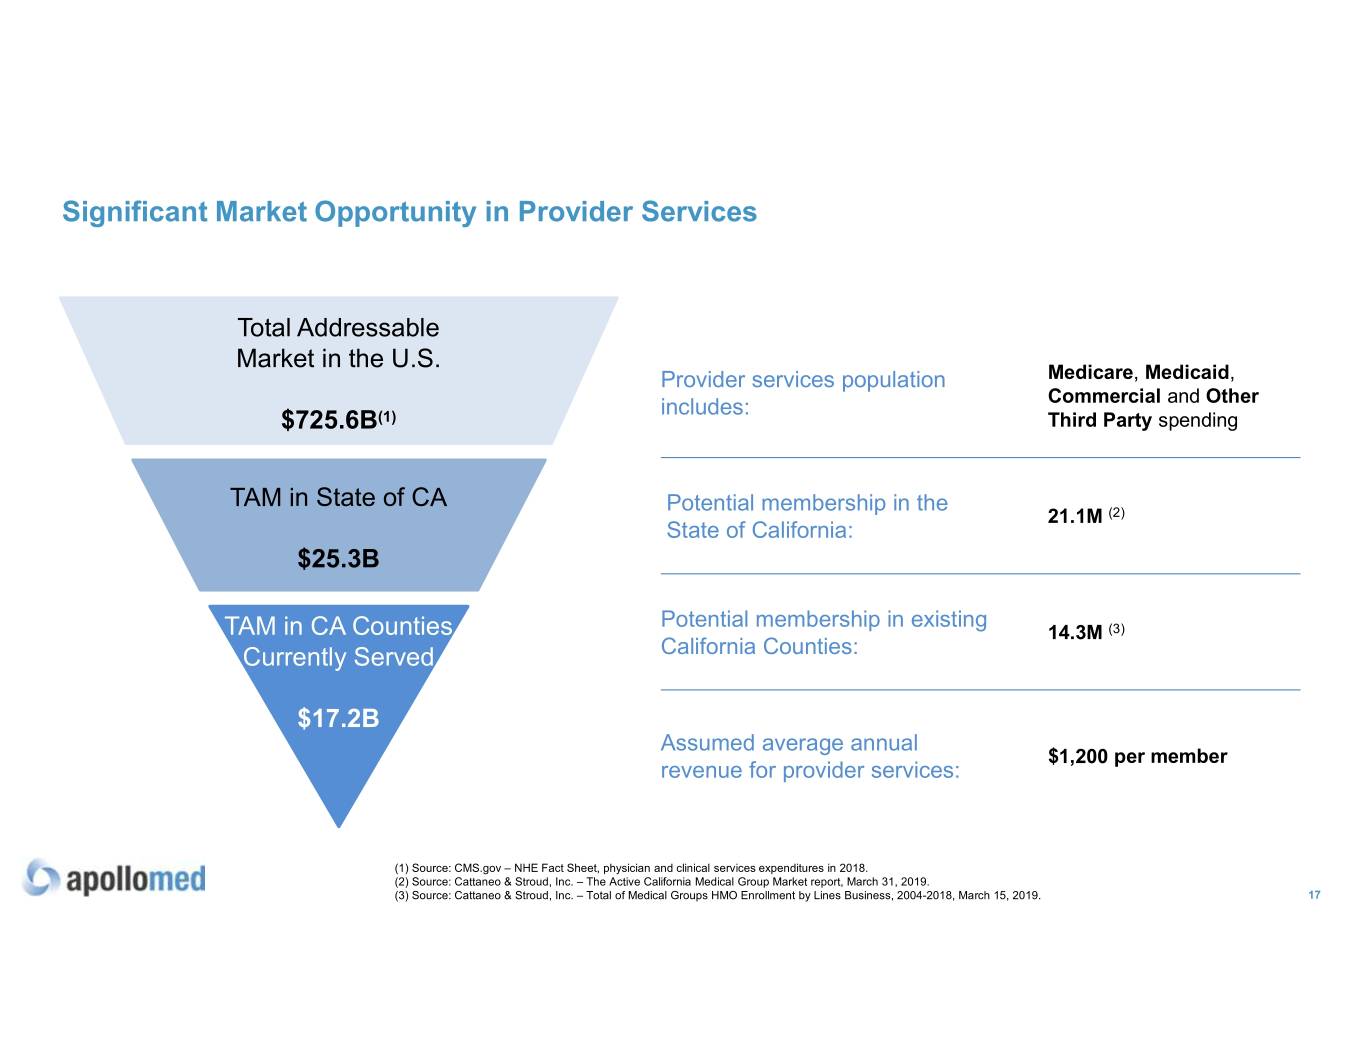
Significant Market Opportunity in Provider Services Total Addressable Market in the U.S. Provider services population Medicare, Medicaid, includes: Commercial and Other $725.6B(1) Third Party spending TAM in State of CA Potential membership in the 21.1M (2) State of California: $25.3B Potential membership in existing TAM in CA Counties 14.3M (3) Currently Served California Counties: $17.2B Assumed average annual $1,200 per member revenue for provider services: (1) Source: CMS.gov – NHE Fact Sheet, physician and clinical services expenditures in 2018. (2) Source: Cattaneo & Stroud, Inc. – The Active California Medical Group Market report, March 31, 2019. (3) Source: Cattaneo & Stroud, Inc. – Total of Medical Groups HMO Enrollment by Lines Business, 2004-2018, March 15, 2019. 17
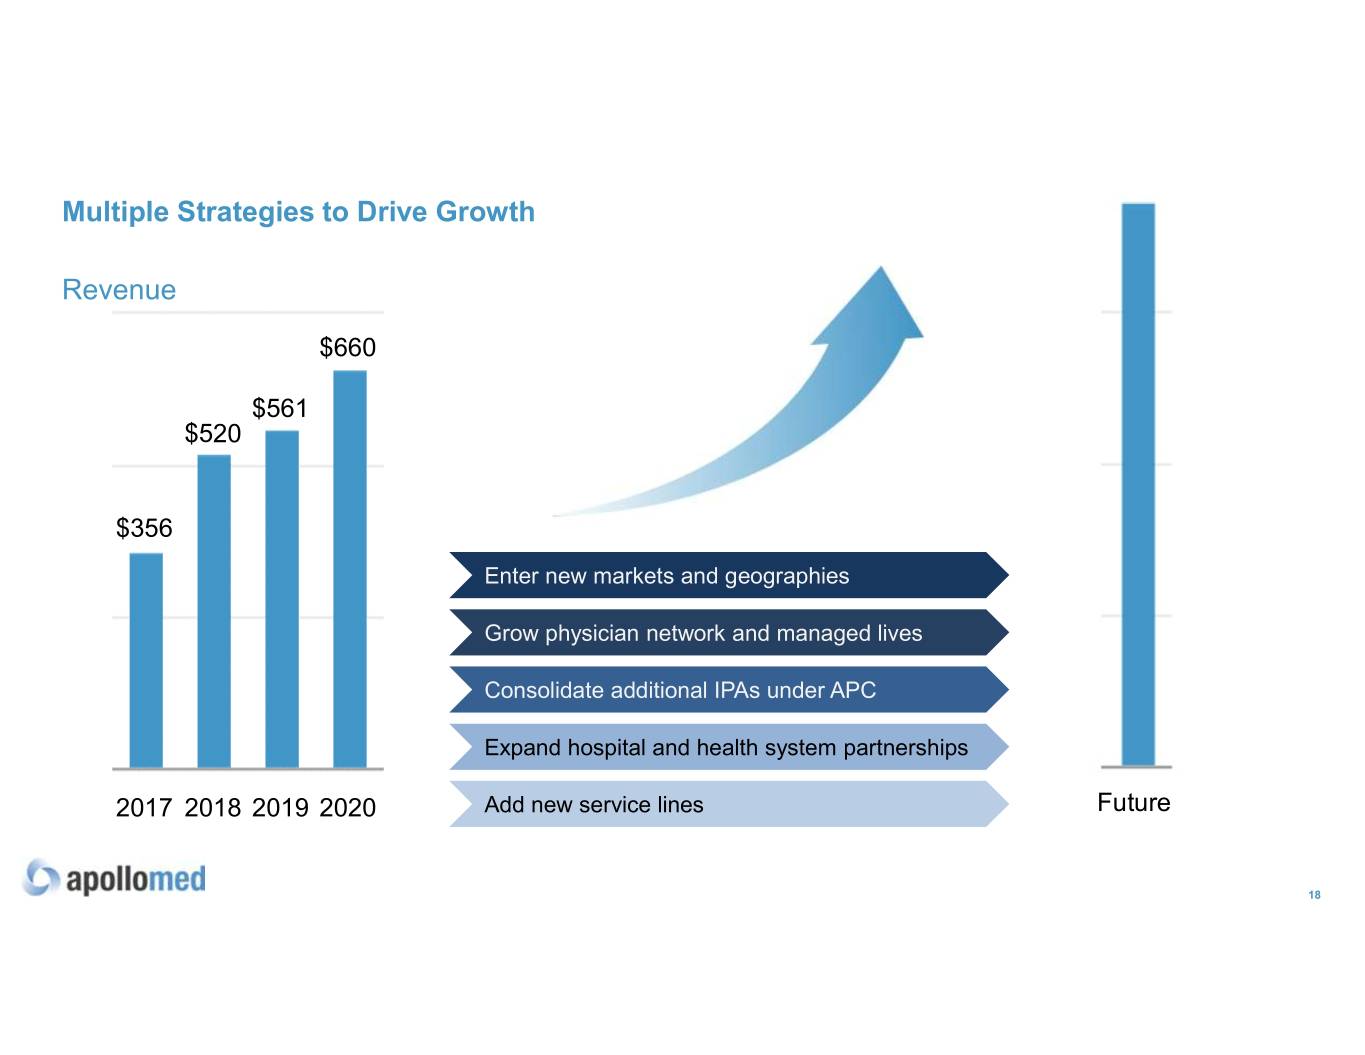
Multiple Strategies to Drive Growth Revenue $660 $561 $520 $356 Enter new markets and geographies Grow physician network and managed lives Consolidate additional IPAs under APC Expand hospital and health system partnerships 2017 2018 2019 2020 Add new service lines Future 18

Financial Overview 19
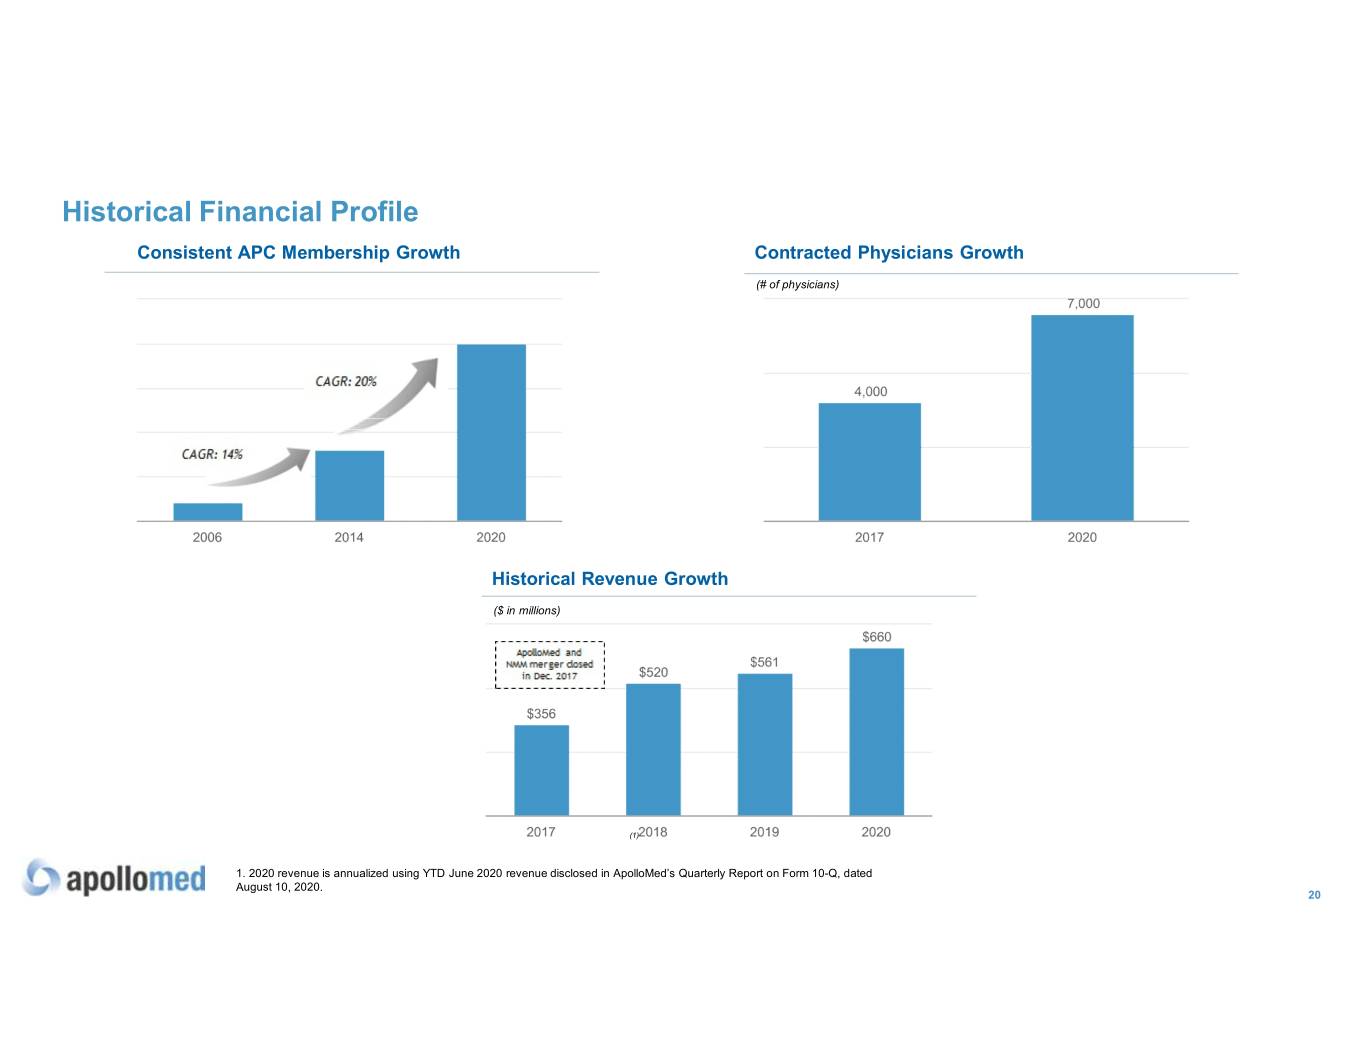
Historical Financial Profile Consistent APC Membership Growth Contracted Physicians Growth (# of physicians) Historical Revenue Growth ($ in millions) (1) 1. 2020 revenue is annualized using YTD June 2020 revenue disclosed in ApolloMed’s Quarterly Report on Form 10-Q, dated August 10, 2020. 20
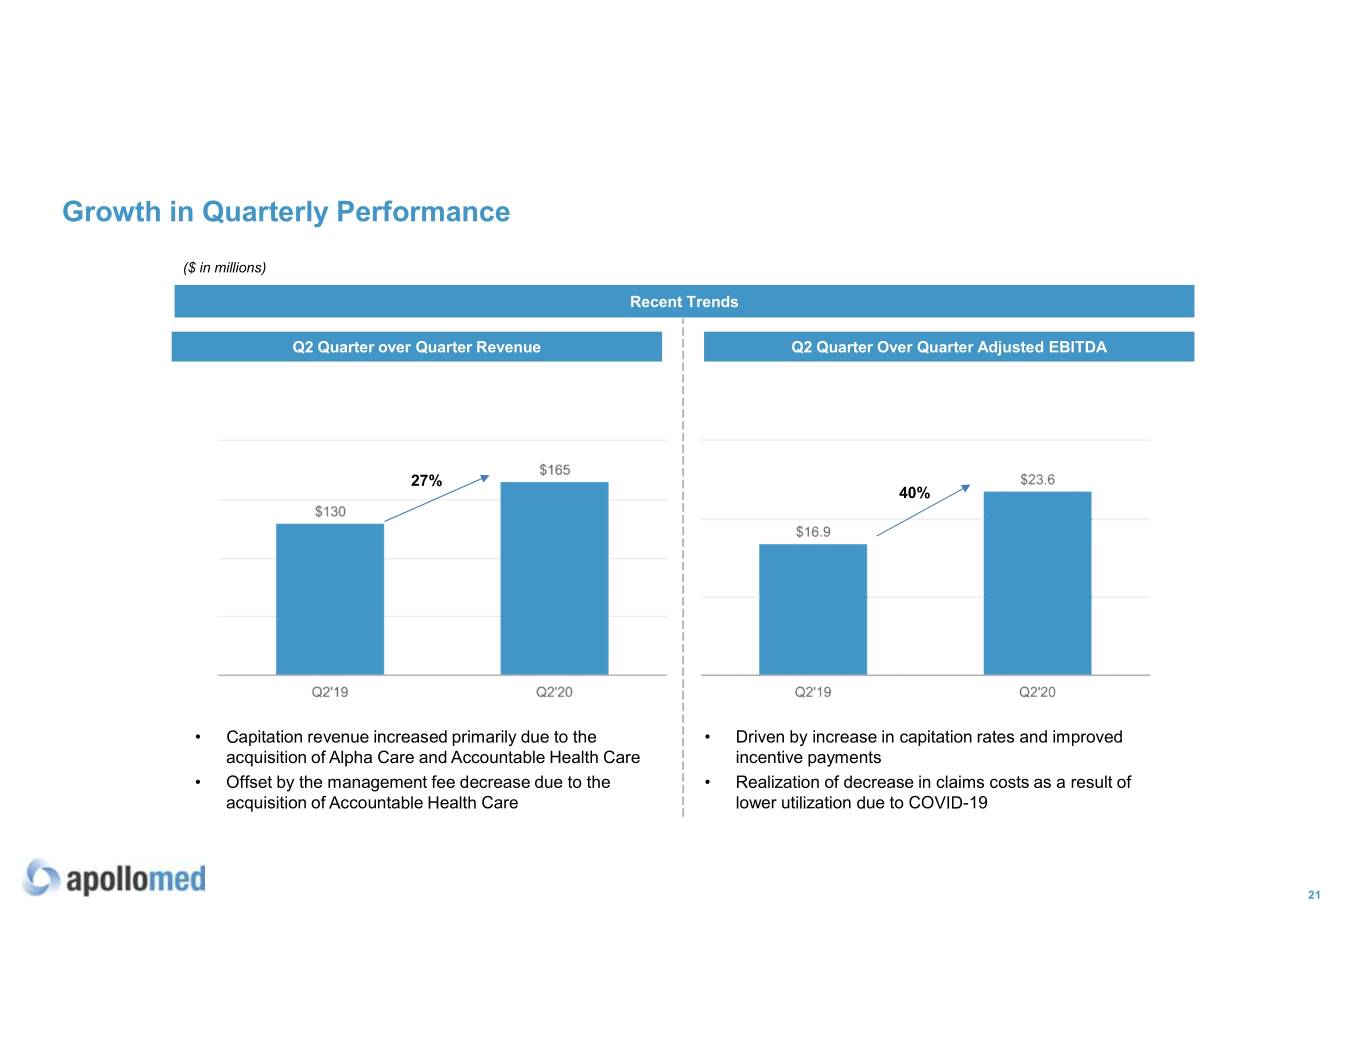
Growth in Quarterly Performance ($ in millions) Recent Trends Q2 Quarter over Quarter Revenue Q2 Quarter Over Quarter Adjusted EBITDA 27% 40% • Capitation revenue increased primarily due to the • Driven by increase in capitation rates and improved acquisition of Alpha Care and Accountable Health Care incentive payments • Offset by the management fee decrease due to the • Realization of decrease in claims costs as a result of acquisition of Accountable Health Care lower utilization due to COVID-19 21
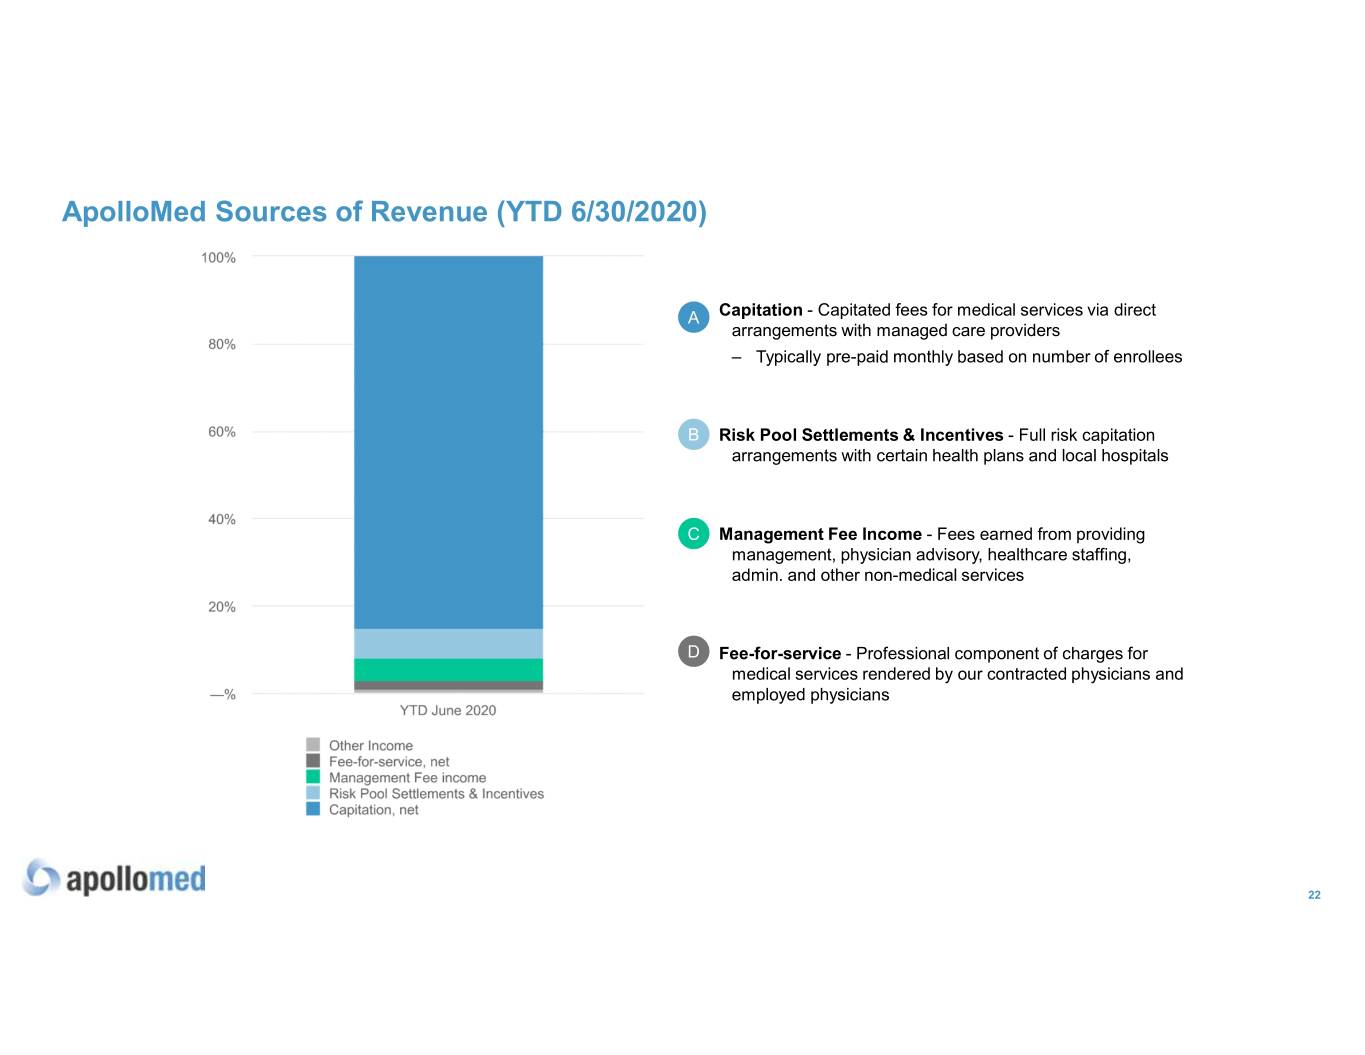
ApolloMed Sources of Revenue (YTD 6/30/2020) A Capitation - Capitated fees for medical services via direct arrangements with managed care providers – Typically pre-paid monthly based on number of enrollees B Risk Pool Settlements & Incentives - Full risk capitation arrangements with certain health plans and local hospitals 8 1 % C Management Fee Income - Fees earned from providing management, physician advisory, healthcare staffing, admin. and other non-medical services D Fee-for-service - Professional component of charges for medical services rendered by our contracted physicians and employed physicians 22
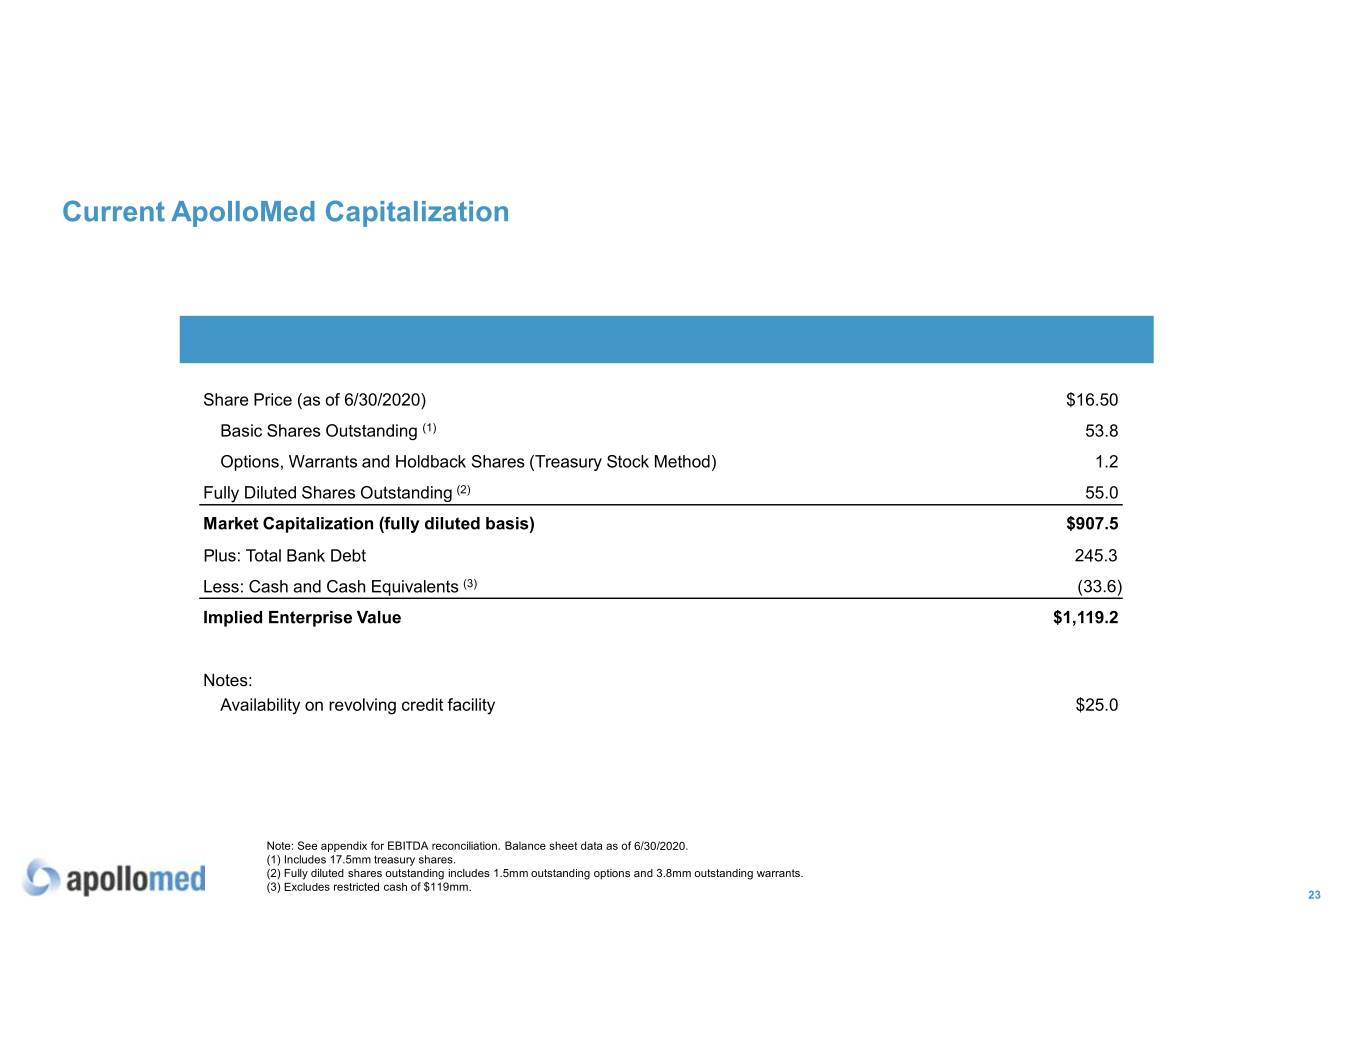
Current ApolloMed Capitalization ($ millions, except for per share price) Share Price (as of 6/30/2020) $16.50 Basic Shares Outstanding (1) 53.8 Options, Warrants and Holdback Shares (Treasury Stock Method) 1.2 Fully Diluted Shares Outstanding (2) 55.0 Market Capitalization (fully diluted basis) $907.5 Plus: Total Bank Debt 245.3 Less: Cash and Cash Equivalents (3) (33.6) Implied Enterprise Value $1,119.2 Notes: Availability on revolving credit facility $25.0 Note: See appendix for EBITDA reconciliation. Balance sheet data as of 6/30/2020. (1) Includes 17.5mm treasury shares. (2) Fully diluted shares outstanding includes 1.5mm outstanding options and 3.8mm outstanding warrants. (3) Excludes restricted cash of $119mm. 23

Appendix
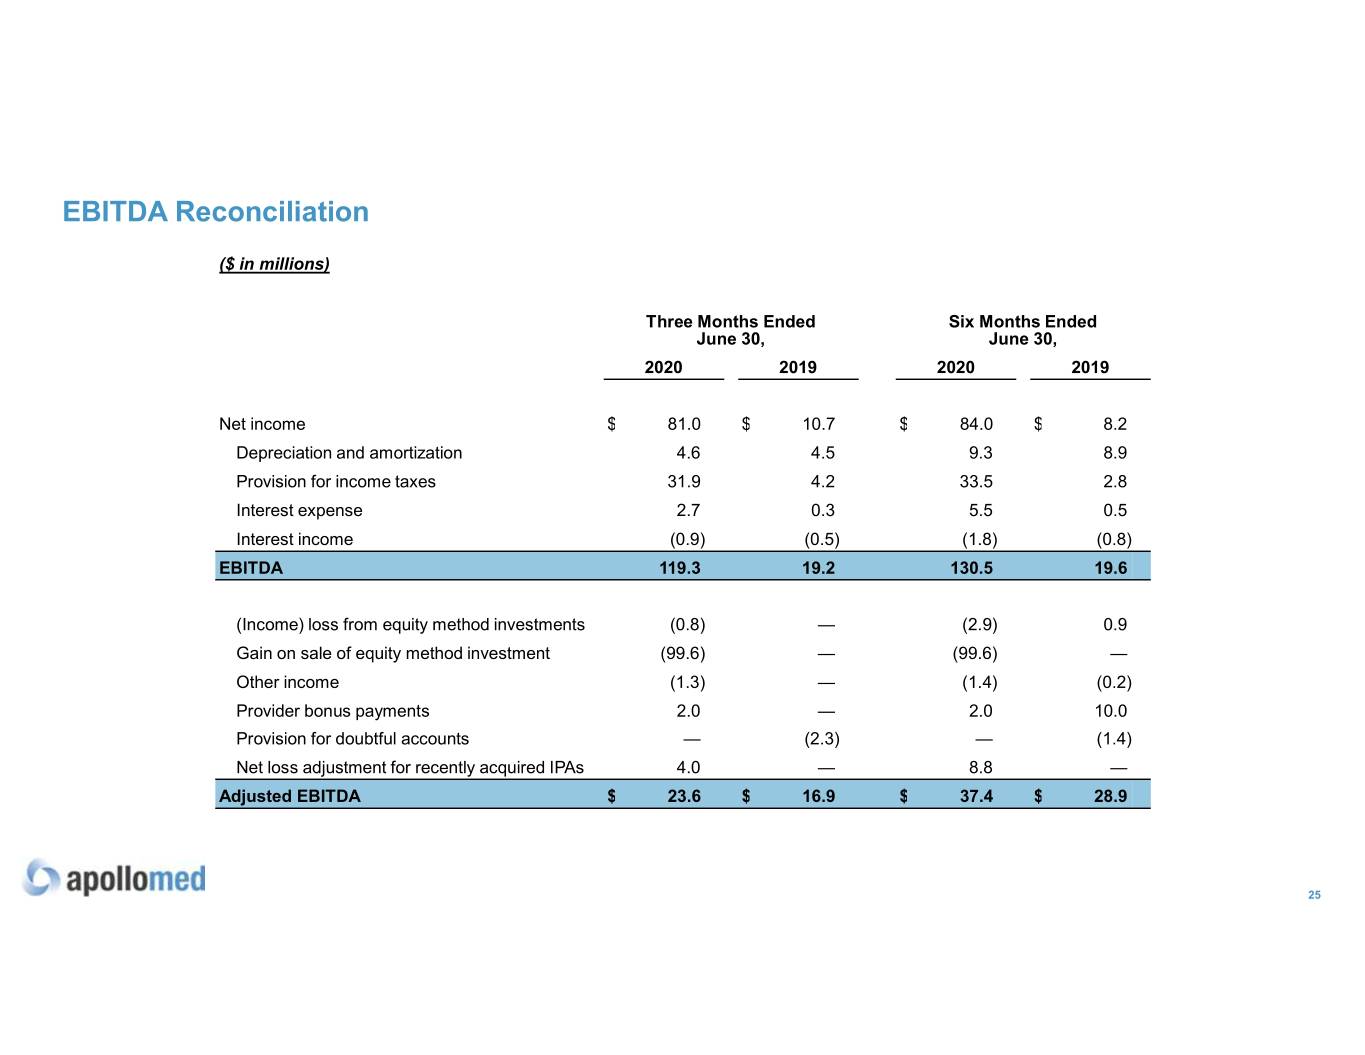
EBITDA Reconciliation ($ in millions) Three Months Ended Six Months Ended June 30, June 30, 2020 2019 2020 2019 Net income $ 81.0 $ 10.7 $ 84.0 $ 8.2 Depreciation and amortization 4.6 4.5 9.3 8.9 Provision for income taxes 31.9 4.2 33.5 2.8 Interest expense 2.7 0.3 5.5 0.5 Interest income (0.9) (0.5) (1.8) (0.8) EBITDA 119.3 19.2 130.5 19.6 (Income) loss from equity method investments (0.8) — (2.9) 0.9 Gain on sale of equity method investment (99.6) — (99.6) — Other income (1.3) — (1.4) (0.2) Provider bonus payments 2.0 — 2.0 10.0 Provision for doubtful accounts — (2.3) — (1.4) Net loss adjustment for recently acquired IPAs 4.0 — 8.8 — Adjusted EBITDA $ 23.6 $ 16.9 $ 37.4 $ 28.9 25
EBITDA Reconciliation Use of Non-GAAP Financial Measures This presentation contains the non-GAAP financial measures Earnings Before Interest, Taxes, Depreciation and Amortization (“EBITDA”) and Adjusted EBITDA, of which the most directly comparable financial measure presented in accordance with GAAP is net (loss) income. These measures are not in accordance with, or are an alternative to, U.S. generally accepted accounting principles, (“GAAP”), and may be different from other non-GAAP financial measures used by other companies. ApolloMed uses Adjusted EBITDA as a supplemental performance measure of its operations, for financial and operational decision-making, and as a supplemental means of evaluating period-to-period comparisons on a consistent basis. Adjusted EBITDA is calculated as earnings before interest, taxes, depreciation, and amortization, excluding losses from equity method investments and other income earned that is not related to ApolloMed's normal operations. Adjusted EBITDA also excludes non recurring items, including those resulting from its adoption related to Accounting Standards Codification 606 - Revenue Recognition, provider bonus payments, net provision for doubtful accounts, impairment of goodwill and intangible assets, severance payments, and the effect on EBITDA of certain IPAs it recently acquired. ApolloMed believes the presentation of these non-GAAP financial measures provides investors with relevant and useful information as it allows investors to evaluate the operating performance of the business activities without having to account for differences recognized because of non-core and non-recurring financial information. When GAAP financial measures are viewed in conjunction with non-GAAP financial measures, investors are provided with a more meaningful understanding of ApolloMed's ongoing operating performance. In addition, these non-GAAP financial measures are among those indicators ApolloMed uses as a basis for evaluating operational performance, allocating resources and planning and forecasting future periods. Non-GAAP financial measures are not intended to be considered in isolation, or as a substitute for, GAAP financial measures. To the extent this release contains historical or future non-GAAP financial measures, ApolloMed has provided corresponding GAAP financial measures for comparative purposes. Reconciliation between certain GAAP and non-GAAP measures is provided above. 26
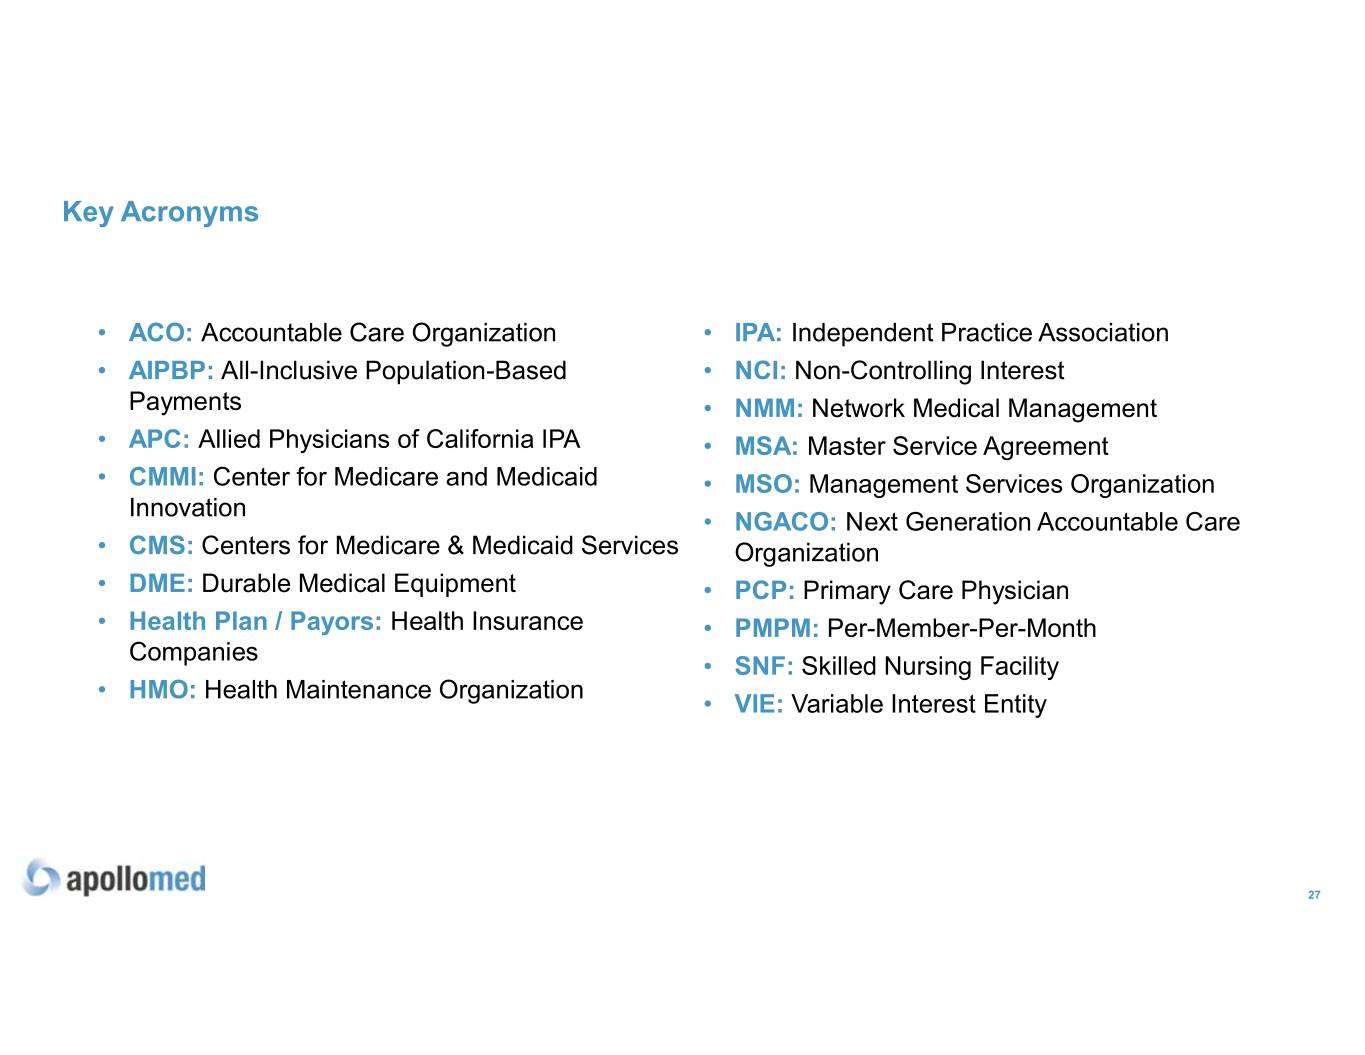
Key Acronyms • ACO: Accountable Care Organization • IPA: Independent Practice Association • AIPBP: All-Inclusive Population-Based • NCI: Non-Controlling Interest Payments • NMM: Network Medical Management • APC: Allied Physicians of California IPA • MSA: Master Service Agreement • CMMI: Center for Medicare and Medicaid • MSO: Management Services Organization Innovation • NGACO: Next Generation Accountable Care • CMS: Centers for Medicare & Medicaid Services Organization • DME: Durable Medical Equipment • PCP: Primary Care Physician • Health Plan / Payors: Health Insurance • PMPM: Per-Member-Per-Month Companies • SNF: Skilled Nursing Facility • HMO: Health Maintenance Organization • VIE: Variable Interest Entity 27