EX-99.2
Published on November 4, 2021

Forward-Looking Statements
This presentation contains forward-looking statements within the meaning of the Private Securities Litigation Reform Act of 1995, Section 27A of the Securities Act and Section 21E of the Exchange Act. Forward-looking statements include any statements about the Company's business, financial condition, operating results, plans, objectives, expectations and intentions, expansion plans, integration of acquired companies and any projections of earnings, revenue, EBITDA, Adjusted EBITDA or other financial items, such as the Company's projected capitation and future liquidity, and may be identified by the use of forward-looking terms such as “anticipate,” “could,” “can,” “may,” “might,” “potential,” “predict,” “should,” “estimate,” “expect,” “project,” “believe,” “plan,” “envision,” “intend,” “continue,” “target,” “seek,” “will,” “would,” and the negative of such terms, other variations on such terms or other similar or comparable words, phrases or terminology. Forward-looking statements reflect current views with respect to future events and financial performance and therefore cannot be guaranteed. Such statements are based on the current expectations and certain assumptions of the Company's management, and some or all of such expectations and assumptions may not materialize or may vary significantly from actual results. Actual results may also vary materially from forward-looking statements due to risks, uncertainties and other factors, known and unknown, including the risk factors described from time to time in the Company’s reports to the U.S. Securities and Exchange Commission (the “SEC”), including without limitation the risk factors discussed in the Company's Annual Report on Form 10-K for the year ended December 31, 2020, and subsequent Quarterly Reports on Form 10-Q.
Because the factors referred to above could cause actual results or outcomes to differ materially from those expressed or implied in any forward-looking statements, you should not place undue reliance on any such forward-looking statements. Any forward-looking statements speak only as of the date of this presentation and, unless legally required, the Company does not undertake any obligation to update any forward-looking statement, as a result of new information, future events or otherwise.
 |
www.apollomed.net | 2 |
||||||
Company Overview
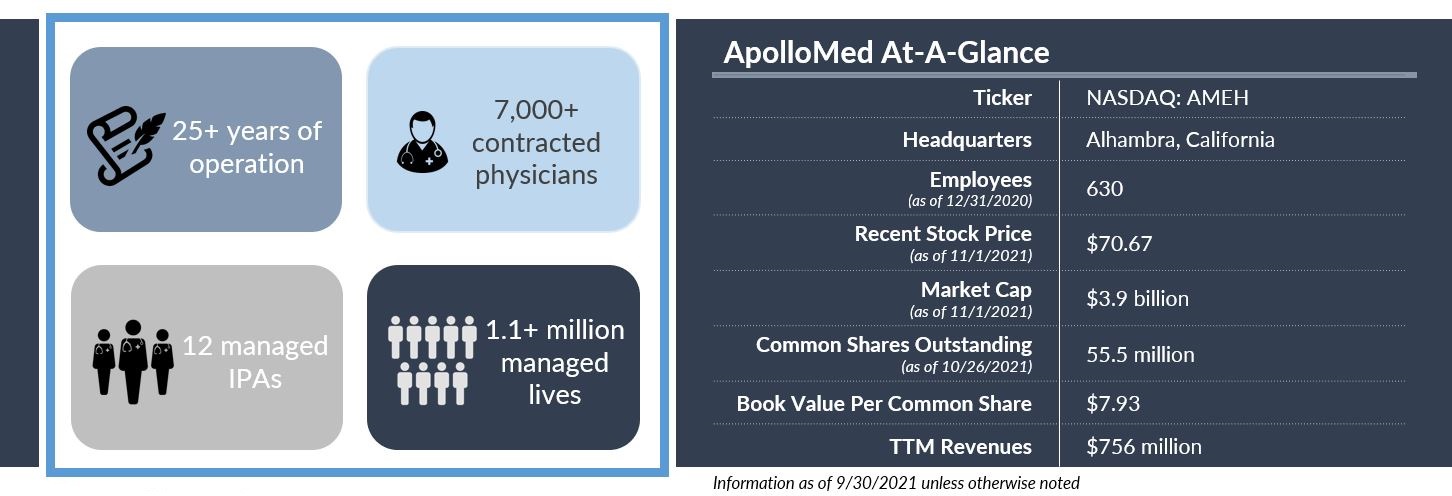
Apollo Medical Holdings, Inc. (“ApolloMed”) is a leading physician-centric, technology-powered, risk-bearing healthcare company. Leveraging its proprietary end-to-end technology solutions, ApolloMed operates an integrated healthcare delivery platform that enables providers to successfully participate in value-based care arrangements, thus empowering them to deliver high-quality care to patients in a cost-effective manner.
 |
www.apollomed.net | 3 |
||||||
Q3 Highlights
 |
 |
 |
||||||||||||||||||
| Strong financial results | Stellar ACO performance in 2020 | Strategic transactions | ||||||||||||||||||
| EPS (diluted) | $0.74 |
 64% from $0.45 64% from $0.45
|
Generated $57.7M in gross savings, highest dollar amount out of all ACOs in the country |
Closed the following transactions in Q3 2021:
• CAIPA MSO
• Access Primary Care Medical Group
•Sun Labs
|
||||||||||||||||
| Revenue | $227.1M |
 26% from $180.1M 26% from $180.1M
|
||||||||||||||||||
| Net income attr. to AMEH | $34.3M |
 105% from $16.7M 105% from $16.7M
|
• $21.8M impact on top line
|
|||||||||||||||||
| Adj. EBITDA* | $74.5M |
 40% from $53.4M 40% from $53.4M
|
• $13.1M impact on bottom line
|
Signed agreement to purchase remaining 60% of equity interests in Diagnostic Medical Group of Southern California (DMG)
|
||||||||||||||||
| *See “Reconciliation of Net Income to EBITDA and Adjusted EBITDA” and “Use of Non-GAAP Financial Measures” slides for more information. | ||||||||||||||||||||
 |
www.apollomed.net | 4 |
||||||
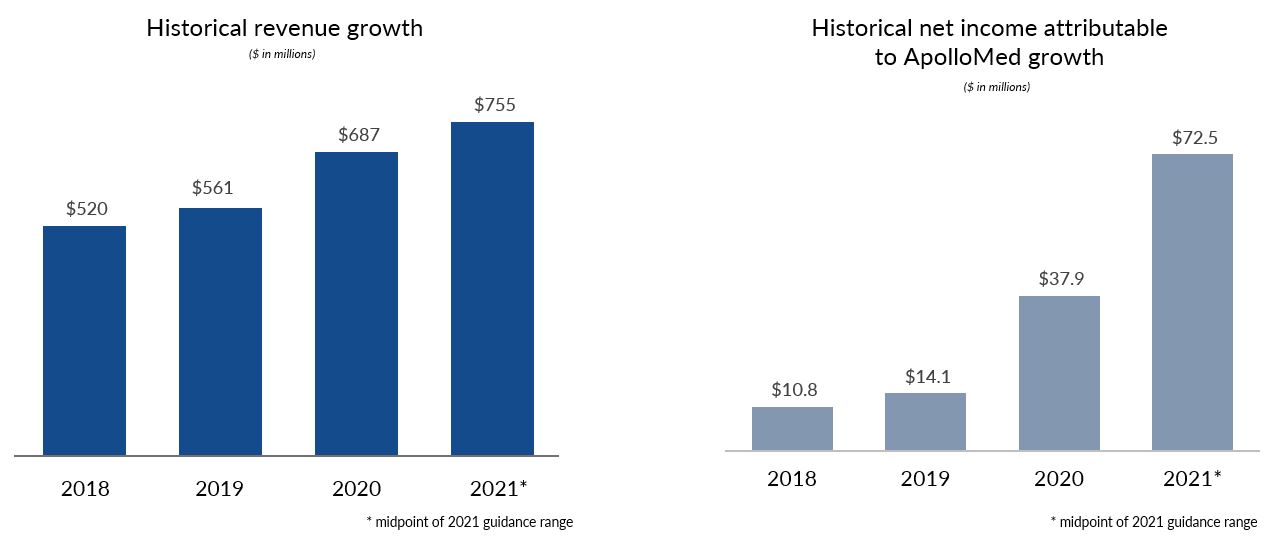
Historical Financial Profile
 |
www.apollomed.net | 5 |
||||||
Summary of Selected Financial Results
| Three Months Ended September 30, | Nine Months Ended September 30, | ||||||||||||||||||||||||||||
| $ in 000s except per share data | 2021 | 2020 | 2021 | 2020 | |||||||||||||||||||||||||
| Revenue | |||||||||||||||||||||||||||||
| Capitation, net | $ | 149,059 | $ | 135,032 | $ | 438,350 | $ | 416,402 | |||||||||||||||||||||
| Risk pool settlements and incentives | 59,923 | 30,916 | 94,146 | 54,155 | |||||||||||||||||||||||||
| Management fee income | 9,652 | 8,707 | 26,345 | 26,212 | |||||||||||||||||||||||||
| Fee-for-service, net | 7,260 | 3,737 | 14,968 | 9,434 | |||||||||||||||||||||||||
| Other income | 1,223 | 1,731 | 5,006 | 4,194 | |||||||||||||||||||||||||
| Total revenue | 227,117 | 180,123 | 578,815 | 510,397 | |||||||||||||||||||||||||
| Total expenses | 173,957 | 142,767 | 482,884 | 455,770 | |||||||||||||||||||||||||
| Income from operations | 53,160 | 37,356 | 95,931 | 54,627 | |||||||||||||||||||||||||
| Net (loss) income | (5,385) | 25,424 | 68,603 | 109,412 | |||||||||||||||||||||||||
| Net (loss) income attributable to noncontrolling interest | (39,664) | 8,711 | 8,515 | 81,603 | |||||||||||||||||||||||||
| Net income attributable to ApolloMed | $ | 34,279 | $ | 16,713 | $ | 60,088 | $ | 27,809 | |||||||||||||||||||||
| Earnings per share - diluted | $ | 0.74 | $ | 0.45 | $ | 1.33 | $ | 0.75 | |||||||||||||||||||||
 |
www.apollomed.net | 6 |
||||||
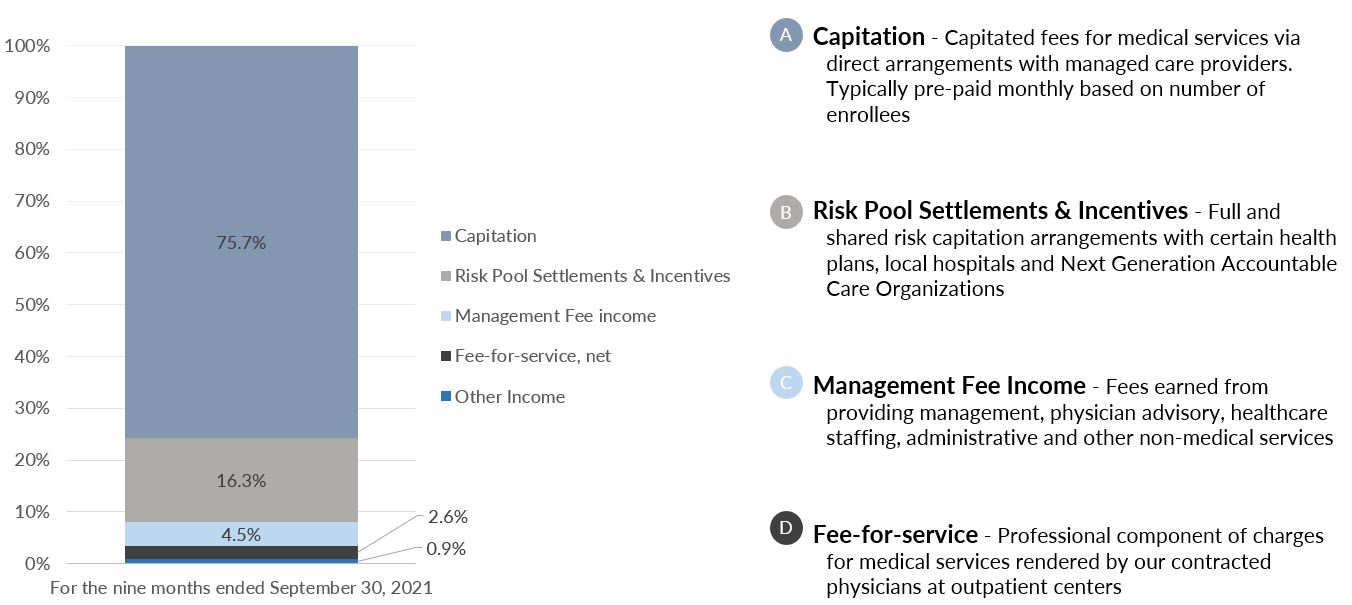
Revenue Breakdown
 |
www.apollomed.net | 7 |
||||||
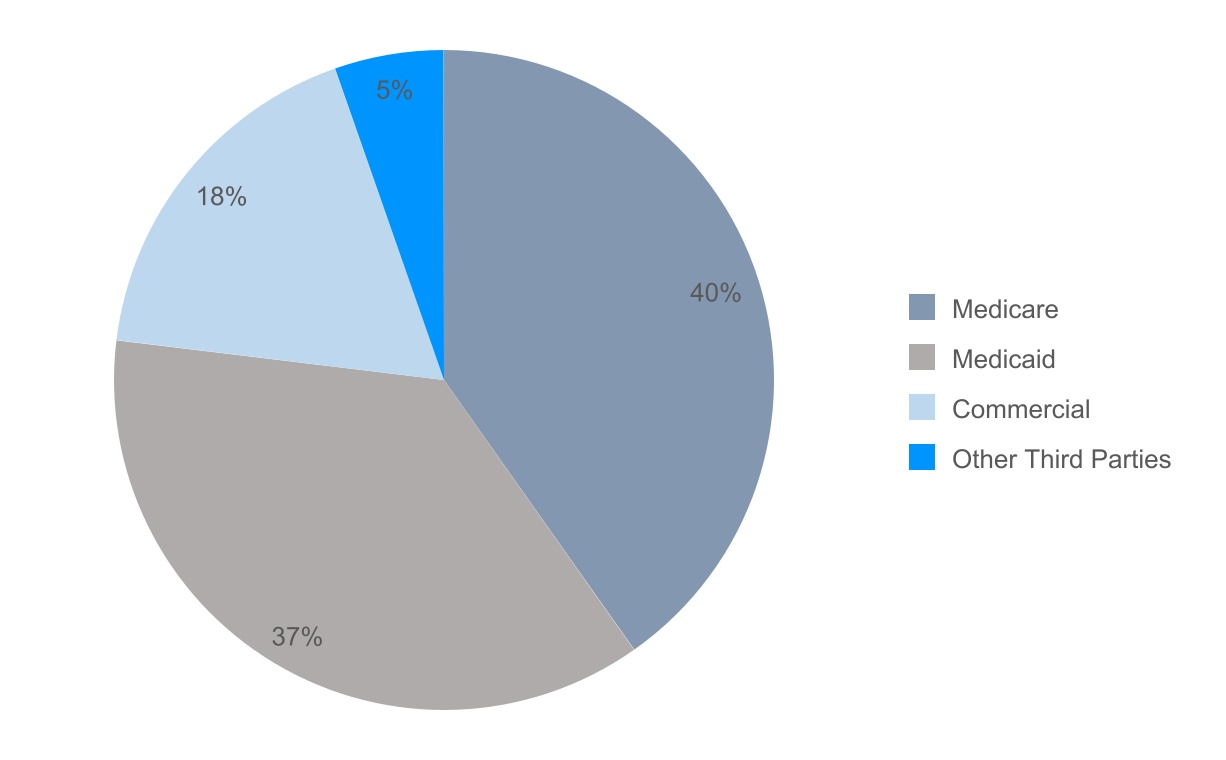
Business Mix by Payer Type
YTD (Q1 - Q3) 2021
(% OF TOTAL REVENUE)
 |
www.apollomed.net | 8 |
||||||
Balance Sheet Highlights
| $ in millions | 9/30/2021 | 12/31/2020 | $ Change | % Change | |||||||||||||||||||||||||
| Cash and cash equivalents and investments in marketable securities | $333.3 | $261.2 | $72.2 |  |
28% | ||||||||||||||||||||||||
| Working capital | $310.5 | $223.6 | $86.9 |  |
39% | ||||||||||||||||||||||||
| Total stockholders’ equity | $440.3 | $330.9 | $109.4 |  |
33% | ||||||||||||||||||||||||
 |
www.apollomed.net | 9 |
||||||
Current Capitalization
| (figures in millions, except per share price) | |||||||||||
| Recent Share Price (as of 11/1/2021) | $ | 70.67 | |||||||||
| Common Shares Outstanding | 55.5 | ||||||||||
| Market Capitalization | $ | 3,922.2 | |||||||||
| Plus: Total Bank Debt | 187.5 | ||||||||||
Less: Cash and Cash Equivalents (1)
|
(145.7) | ||||||||||
| Implied Enterprise Value | $ | 3,964.0 | |||||||||
| Notes: Letters of Credit Availability on Revolving Credit Facility | $ | 25.0 | |||||||||
Note: Data is as of 9/30/2021 unless otherwise stated.
(1) Excludes restricted cash of $59.1M
 |
www.apollomed.net | 10 |
||||||
Updated 2021 Guidance
| $ in millions, except per share information | 2021 Guidance Range (as of August 5, 2021) |
2021 Guidance Range (as of November 4, 2021) |
||||||||||||
| Total Revenue | $700 - $720 | $751.5 - $758.5 | ||||||||||||
Net Income(1)
|
$56 - $66 | $81 - $83.5 | ||||||||||||
| Net Income Attributable to ApolloMed | $48 - $58 | $71.5 - $73.5 | ||||||||||||
Earnings per share - Diluted(2)
|
— | $1.58 - $1.62 | ||||||||||||
EBITDA(3)
|
$100 - $119 | $139 - $143 | ||||||||||||
Adjusted EBITDA(3)
|
$120.5 - $130.5 | $168.5 - $170.5 | ||||||||||||
(1) Updated net income and EBITDA forecast is a result of APC’s investment in a payor partner that completed an initial public offering and became publicly traded on June 24, 2021. The revised net income and EBITDA guidance ranges assume the payor partner’s stock price of $8.49.
(2) Range was not previously provided as of August 5, 2021.
(3) See “Guidance Reconciliation of Net Income to EBITDA and Adjusted EBITDA” and “Use of Non-GAAP Financial Measures” slides for more information. There can be no assurance that actual amounts will not be materially higher or lower than these expectations. See “Forward-Looking Statements” on slide 2.
 |
www.apollomed.net | 11 |
||||||
Reconciliation of Net Income to EBITDA and Adjusted EBITDA
| Three Months Ended September 30, | Nine Months Ended September 30, | |||||||||||||||||||||||||
| ($ in millions) | 2021 | 2020 | 2021 | 2020 | ||||||||||||||||||||||
| Net (loss) income | $ | (5.4) | $ | 25.4 | $ | 68.6 | $ | 109.4 | ||||||||||||||||||
| Interest expense | 1.0 | 2.5 | 4.3 | 8.0 | ||||||||||||||||||||||
| Interest income | (0.4) | (0.8) | (1.3) | (2.5) | ||||||||||||||||||||||
| (Benefit from) provision for income taxes | (0.1) | 10.8 | 31.6 | 44.2 | ||||||||||||||||||||||
| Depreciation and amortization | 4.7 | 4.7 | 13.1 | 14.0 | ||||||||||||||||||||||
EBITDA(1)
|
$ | (0.3) | $ | 42.6 | $ | 116.3 | $ | 173.1 | ||||||||||||||||||
| (Income) loss from equity method investments | $ | (0.1) | $ | (0.4) | $ | 3.7 | $ | (3.3) | ||||||||||||||||||
| Gain on sale of equity method investment | (2.2) | — | (2.2) | (99.6) | ||||||||||||||||||||||
| Other (income) expense | (0.5) | (0.1) | 14.1 | (1.5) | ||||||||||||||||||||||
| Unrealized loss (gain) on investments | 60.9 | — | (22.8) | — | ||||||||||||||||||||||
| Provider bonus payments | 8.7 | 6.5 | 8.7 | 8.5 | ||||||||||||||||||||||
| Net loss adjustment for recently acquired IPAs | 7.9 | 4.8 | 16.6 | 13.7 | ||||||||||||||||||||||
Adjusted EBITDA(1)
|
$ | 74.5 | $ | 53.4 | $ | 134.4 | $ | 90.8 | ||||||||||||||||||
(1) See “Use of Non-GAAP Financial Measures” slide for more information.
 |
www.apollomed.net | 12 |
||||||
Guidance Reconciliation of Net Income to EBITDA and Adjusted EBITDA
| 2021 Guidance Range (as of August 5, 2021) |
2021 Guidance Range (as of November 4, 2021) |
|||||||||||||||||||||||||
| ($ in millions) | Low | High | Low | High | ||||||||||||||||||||||
| Net income | $ | 56.0 | $ | 66.0 | $ | 81.0 | $ | 83.5 | ||||||||||||||||||
| Interest expense | 6.0 | 8.4 | 5.0 | 6.0 | ||||||||||||||||||||||
| Interest income | (1.5) | (2.4) | (1.2) | (1.7) | ||||||||||||||||||||||
| Provision for income taxes | 24.0 | 29.0 | 37.0 | 38.0 | ||||||||||||||||||||||
| Depreciation and amortization | 15.5 | 18.0 | 17.2 | 17.2 | ||||||||||||||||||||||
| EBITDA | $ | 100.0 | $ | 119.0 | $ | 139.0 | $ | 143.0 | ||||||||||||||||||
| Loss (income) from equity method investments | $ | 3.5 | $ | (0.5) | $ | (3.9) | $ | (3.6) | ||||||||||||||||||
| Investment in payor partner | (9.0) | (9.0) | — | — | ||||||||||||||||||||||
| Provider bonus payments | 6.0 | 6.0 | 8.9 | 8.9 | ||||||||||||||||||||||
| Net loss adjustment for recently acquired IPAs | 20.0 | 15.0 | 24.5 | 22.2 | ||||||||||||||||||||||
| Adjusted EBITDA | $ | 120.5 | $ | 130.5 | $ | 168.5 | $ | 170.5 | ||||||||||||||||||
 |
www.apollomed.net | 13 |
||||||
Use of Non-GAAP Financial Measures
This presentation contains the non-GAAP financial measures Earnings Before Interest, Taxes, Depreciation and Amortization (“EBITDA”) and Adjusted EBITDA, of which the most directly comparable financial measure presented in accordance with GAAP is net (loss) income. These measures are not in accordance with, or are an alternative to, U.S. generally accepted accounting principles (“GAAP”), and may be different from other non-GAAP financial measures used by other companies. ApolloMed uses Adjusted EBITDA as a supplemental performance measure of its operations, for financial and operational decision-making, and as a supplemental means of evaluating period-to-period comparisons on a consistent basis. Adjusted EBITDA is calculated as earnings before interest, taxes, depreciation, and amortization, excluding losses from equity method investments provide bonus payments, impairment of intangibles, provision of doubtful accounts and other income earned that is not related to ApolloMed's normal operations. Adjusted EBITDA also excludes non recurring items, including the effect on EBITDA of certain recently acquired IPAs.
ApolloMed believes the presentation of these non-GAAP financial measures provides investors with relevant and useful information as they allow investors to evaluate the operating performance of the business activities without having to account for differences recognized because of non-core and non-recurring financial information. When GAAP financial measures are viewed in conjunction with non-GAAP financial measures, investors are provided with a more meaningful understanding of ApolloMed's ongoing operating performance. In addition, these non-GAAP financial measures are among those indicators ApolloMed uses as a basis for evaluating operational performance, allocating resources and planning and forecasting future periods. Non-GAAP financial measures are not intended to be considered in isolation, or as a substitute for, GAAP financial measures. To the extent this release contains historical or future non-GAAP financial measures, ApolloMed has provided corresponding GAAP financial measures for comparative purposes. Reconciliation between certain GAAP and non-GAAP measures is provided above.
 |
www.apollomed.net | 14 |
||||||
Key Acronyms
•ACO: Accountable Care Organization
•AIPBP: All-Inclusive Population-Based Payments
•CMMI: Center for Medicare and Medicaid Innovation
•CMS: Centers for Medicare & Medicaid Services
•DME: Durable Medical Equipment
•Health Plan/Payors: Health Insurance Companies
•HMO: Health Maintenance Organization
•IPA: Independent Practice Association
•NCI: Non-Controlling Interest
•NMM: Network Medical Management, Inc.
•MSA: Master Service Agreement
•MSO: Management Services Organization
•NGACO: Next Generation Accountable Care Organization
•PCP: Primary Care Physician
•PMPM: Per Member Per Month
•SNF: Skilled Nursing Facility
•VIE: Variable Interest Entity
 |
www.apollomed.net | 15 |
||||||
