EX-99.2
Published on May 8, 2023

1 Powered by Technology. Built by Doctors. For Patients. Apollo Medical Holdings (NASDAQ: AMEH) First Quarter 2023 Earnings Call Supplement May 8, 2023
Forward-Looking Statements This presentation contains forward-looking statements within the meaning of the Private Securities Litigation Reform Act of 1995, Section 27A of the Securities Act and Section 21E of the Exchange Act. Forward-looking statements include any statements about the Company's business, financial condition, operating results, plans, objectives, expectations and intentions, expansion plans, integration of acquired companies and any projections of earnings, revenue, EBITDA, Adjusted EBITDA or other financial items, such as the Company's projected capitation and future liquidity, and may be identified by the use of forward-looking terms such as “anticipate,” “could,” “can,” “may,” “might,” “potential,” “predict,” “should,” “estimate,” “expect,” “project,” “believe,” “plan,” “envision,” “intend,” “continue,” “target,” “seek,” “will,” “would,” and the negative of such terms, other variations on such terms or other similar or comparable words, phrases or terminology. Forward-looking statements reflect current views with respect to future events and financial performance and therefore cannot be guaranteed. Such statements are based on the current expectations and certain assumptions of the Company’s management, and some or all of such expectations and assumptions may not materialize or may vary significantly from actual results. Actual results may also vary materially from forward-looking statements due to risks, uncertainties and other factors, known and unknown, including the risk factors described from time to time in the Company’s reports to the U.S. Securities and Exchange Commission (the “SEC”), including without limitation the risk factors discussed in the Company's Annual Report on Form 10-K for the year ended December 31, 2022, and subsequent Quarterly Reports on Form 10-Q. Because the factors referred to above could cause actual results or outcomes to differ materially from those expressed or implied in any forward-looking statements, you should not place undue reliance on any such forward-looking statements. Any forward-looking statements speak only as of the date of this presentation and, unless legally required, the Company does not undertake any obligation to update any forward-looking statement, as a result of new information, future events or otherwise. 2
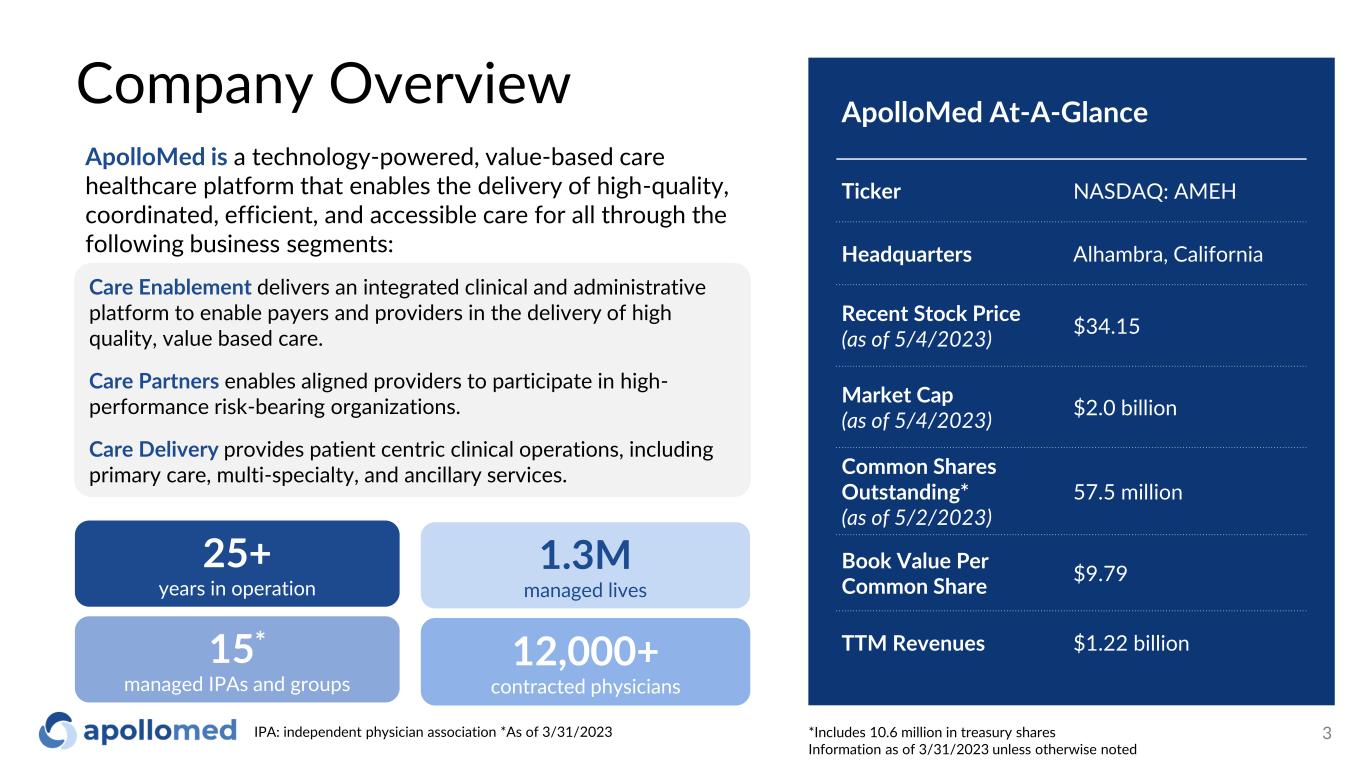
15* managed IPAs and groups 1.3M managed lives Company Overview 3 12,000+ contracted physicians 25+ years in operation ApolloMed is a technology-powered, value-based care healthcare platform that enables the delivery of high-quality, coordinated, efficient, and accessible care for all through the following business segments: Care Enablement delivers an integrated clinical and administrative platform to enable payers and providers in the delivery of high quality, value based care. Care Partners enables aligned providers to participate in high- performance risk-bearing organizations. Care Delivery provides patient centric clinical operations, including primary care, multi-specialty, and ancillary services. ApolloMed At-A-Glance Ticker NASDAQ: AMEH Headquarters Alhambra, California Recent Stock Price (as of 5/4/2023) $34.15 Market Cap (as of 5/4/2023) $2.0 billion Common Shares Outstanding* (as of 5/2/2023) 57.5 million Book Value Per Common Share $9.79 TTM Revenues $1.22 billion IPA: independent physician association *As of 3/31/2023 *Includes 10.6 million in treasury shares Information as of 3/31/2023 unless otherwise noted
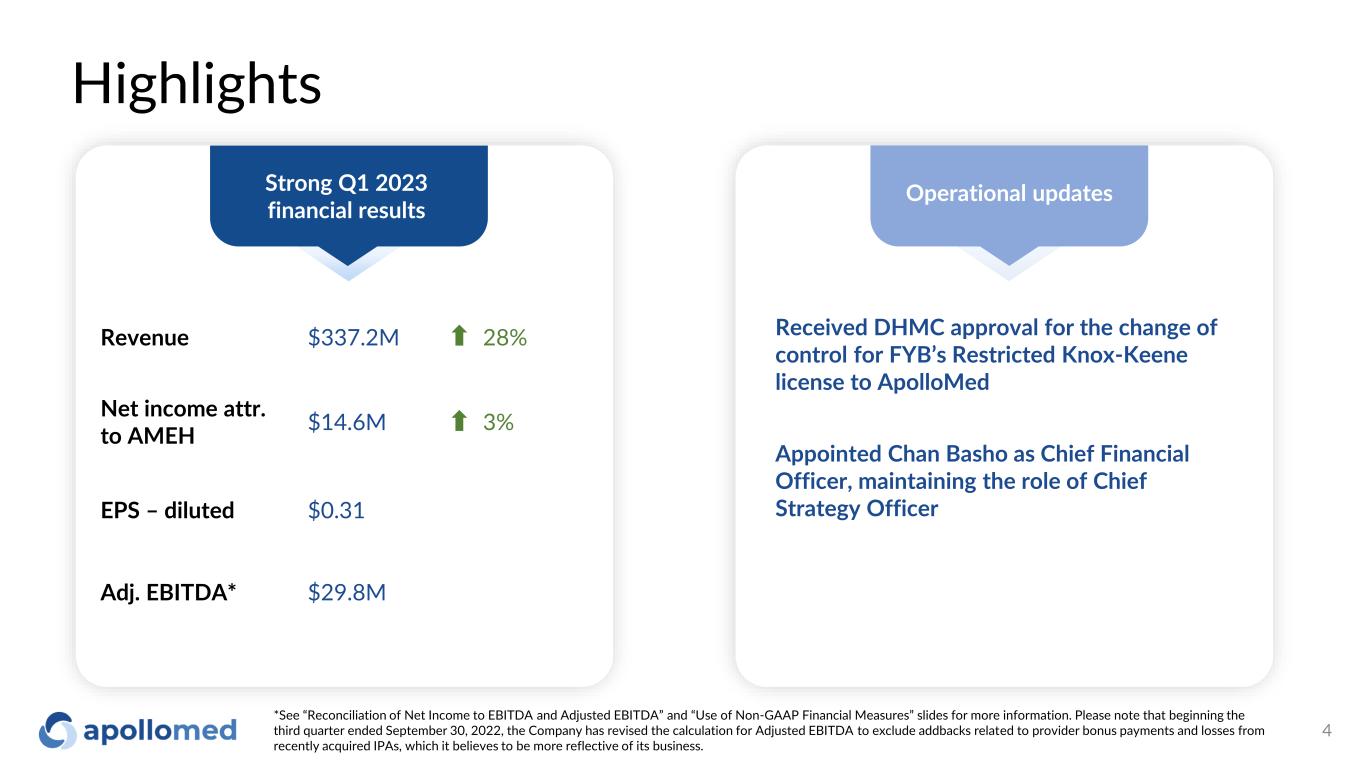
Highlights 4 Strong Q1 2023 financial results Operational updates Revenue $337.2M 28% Net income attr. to AMEH $14.6M 3% EPS – diluted $0.31 Adj. EBITDA* $29.8M Received DHMC approval for the change of control for FYB’s Restricted Knox-Keene license to ApolloMed Appointed Chan Basho as Chief Financial Officer, maintaining the role of Chief Strategy Officer *See “Reconciliation of Net Income to EBITDA and Adjusted EBITDA” and “Use of Non-GAAP Financial Measures” slides for more information. Please note that beginning the third quarter ended September 30, 2022, the Company has revised the calculation for Adjusted EBITDA to exclude addbacks related to provider bonus payments and losses from recently acquired IPAs, which it believes to be more reflective of its business.
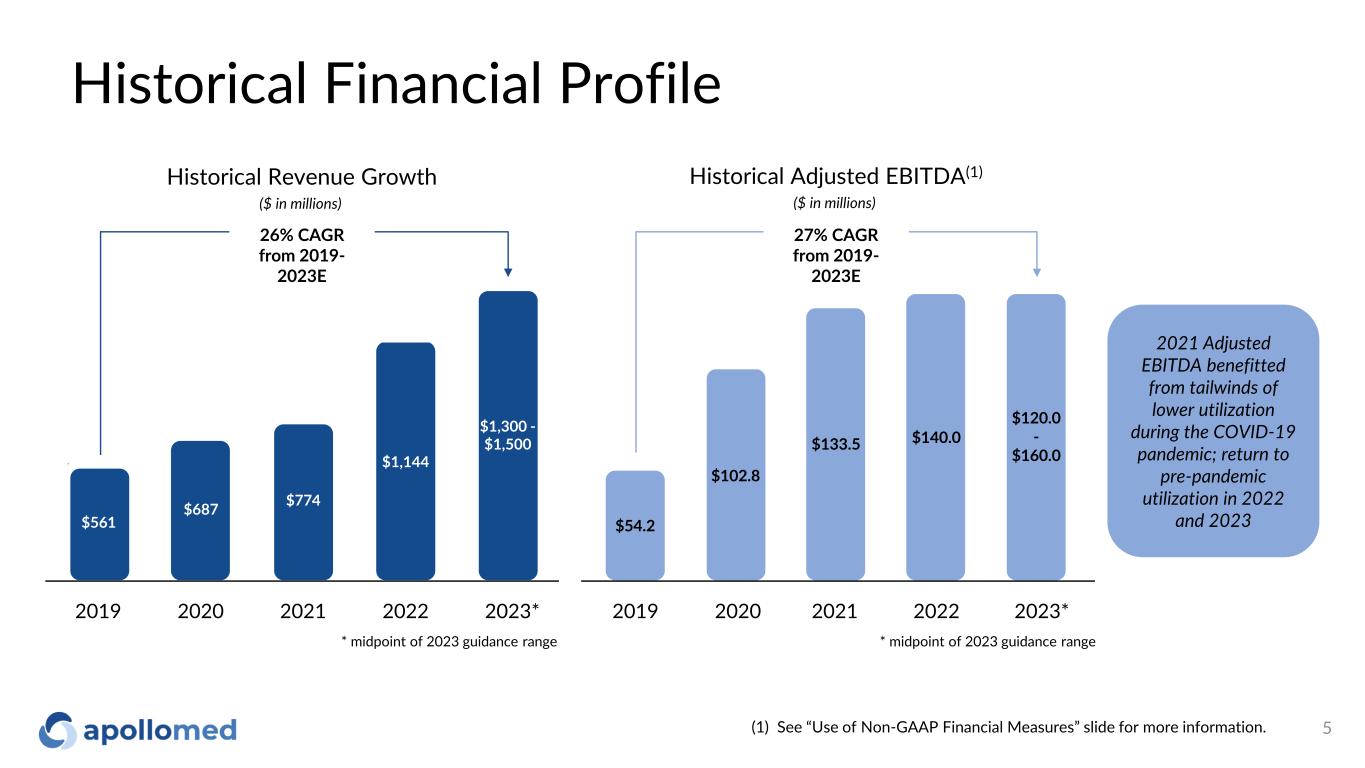
Historical Financial Profile 5 2021 Adjusted EBITDA benefitted from tailwinds of lower utilization during the COVID-19 pandemic; return to pre-pandemic utilization in 2022 and 2023 (1) See “Use of Non-GAAP Financial Measures” slide for more information. $561 $687 $774 $1,144 $1,300 - $1,500 Historical Revenue Growth * midpoint of 2023 guidance range ($ in millions) 2019 2020 2021 2022 2023* 26% CAGR from 2019- 2023E $54.2 $102.8 $133.5 $140.0 ($ in millions) Historical Adjusted EBITDA(1) 27% CAGR from 2019- 2023E 2019 2020 2021 2022 2023* $120.0 - $160.0 * midpoint of 2023 guidance range
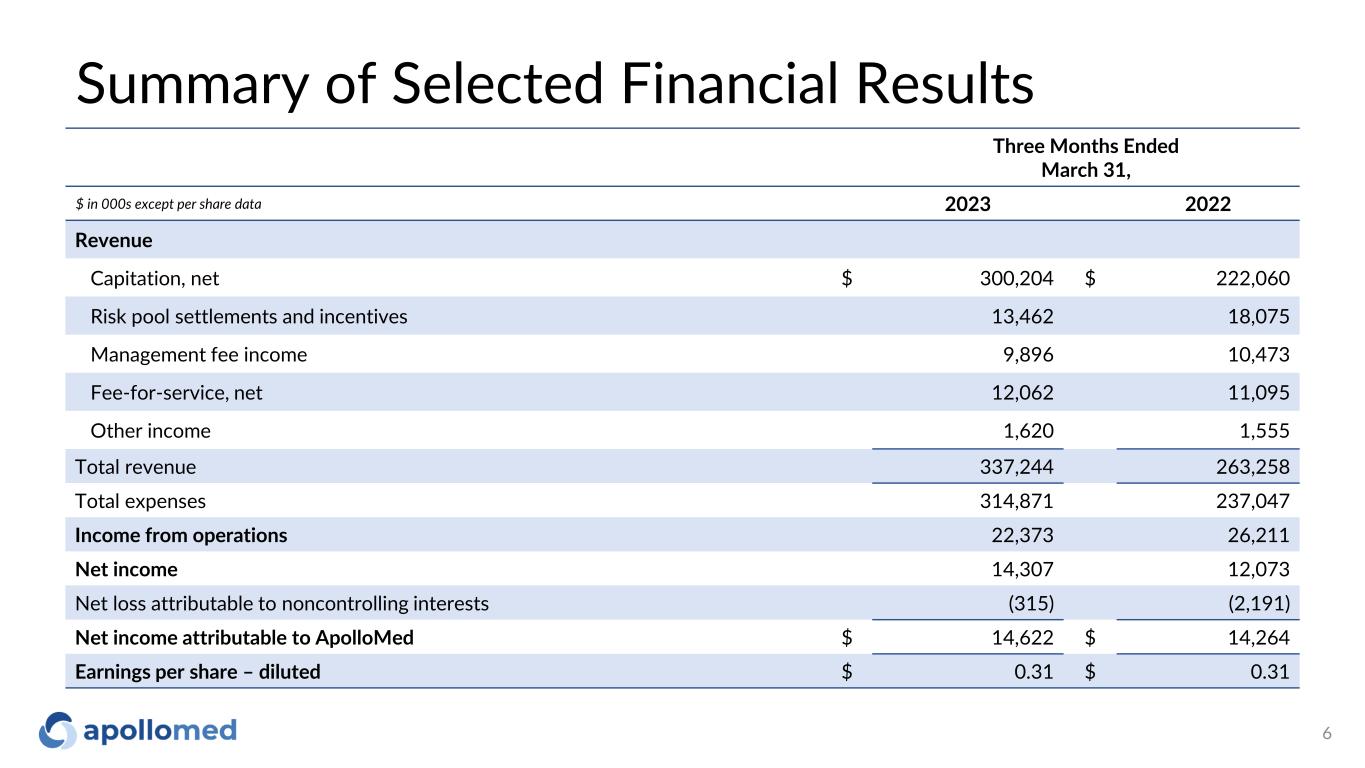
Summary of Selected Financial Results 6 Three Months Ended March 31, $ in 000s except per share data 2023 2022 Revenue Capitation, net $ 300,204 $ 222,060 Risk pool settlements and incentives 13,462 18,075 Management fee income 9,896 10,473 Fee-for-service, net 12,062 11,095 Other income 1,620 1,555 Total revenue 337,244 263,258 Total expenses 314,871 237,047 Income from operations 22,373 26,211 Net income 14,307 12,073 Net loss attributable to noncontrolling interests (315) (2,191) Net income attributable to ApolloMed $ 14,622 $ 14,264 Earnings per share – diluted $ 0.31 $ 0.31
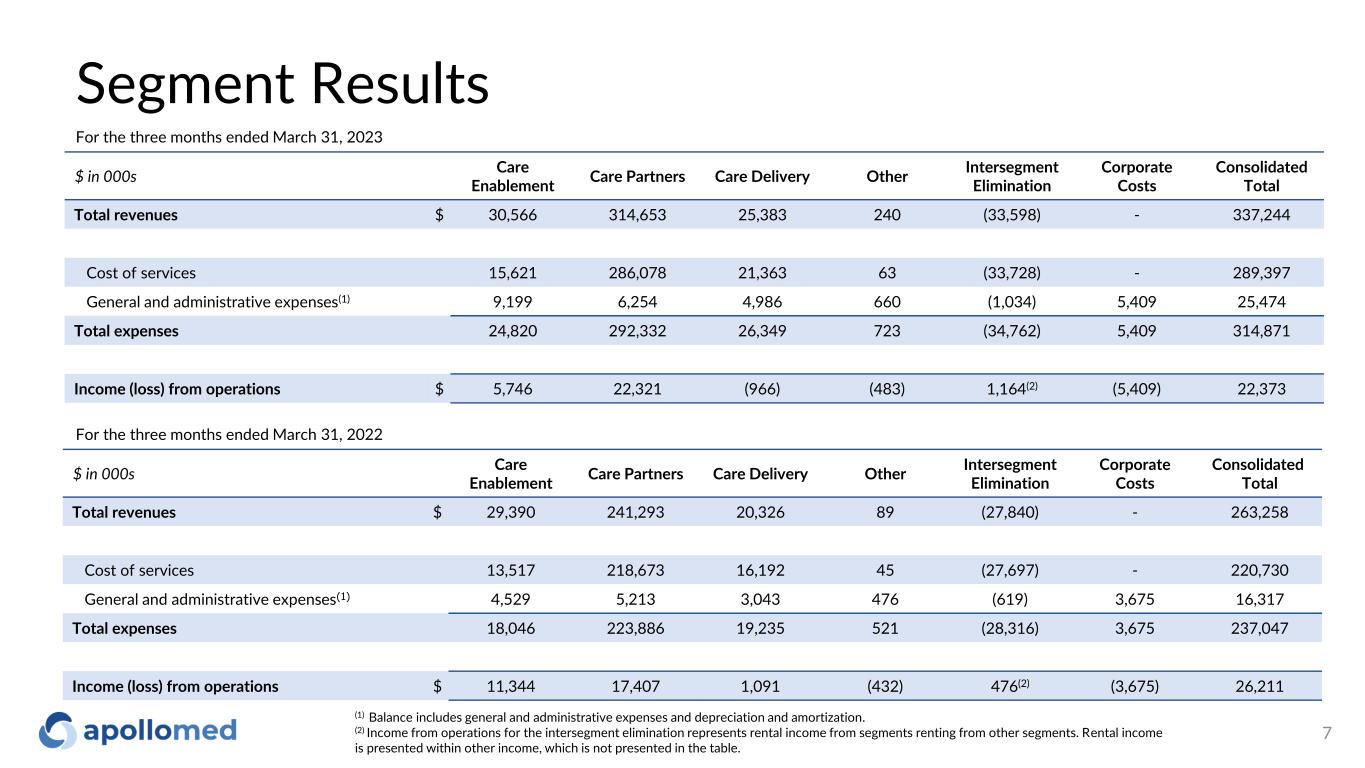
Segment Results 7 $ in 000s Care Enablement Care Partners Care Delivery Other Intersegment Elimination Corporate Costs Consolidated Total Total revenues $ 30,566 314,653 25,383 240 (33,598) - 337,244 Cost of services 15,621 286,078 21,363 63 (33,728) - 289,397 General and administrative expenses(1) 9,199 6,254 4,986 660 (1,034) 5,409 25,474 Total expenses 24,820 292,332 26,349 723 (34,762) 5,409 314,871 Income (loss) from operations $ 5,746 22,321 (966) (483) 1,164(2) (5,409) 22,373 For the three months ended March 31, 2023 $ in 000s Care Enablement Care Partners Care Delivery Other Intersegment Elimination Corporate Costs Consolidated Total Total revenues $ 29,390 241,293 20,326 89 (27,840) - 263,258 Cost of services 13,517 218,673 16,192 45 (27,697) - 220,730 General and administrative expenses(1) 4,529 5,213 3,043 476 (619) 3,675 16,317 Total expenses 18,046 223,886 19,235 521 (28,316) 3,675 237,047 Income (loss) from operations $ 11,344 17,407 1,091 (432) 476(2) (3,675) 26,211 For the three months ended March 31, 2022 (1) Balance includes general and administrative expenses and depreciation and amortization. (2) Income from operations for the intersegment elimination represents rental income from segments renting from other segments. Rental income is presented within other income, which is not presented in the table.
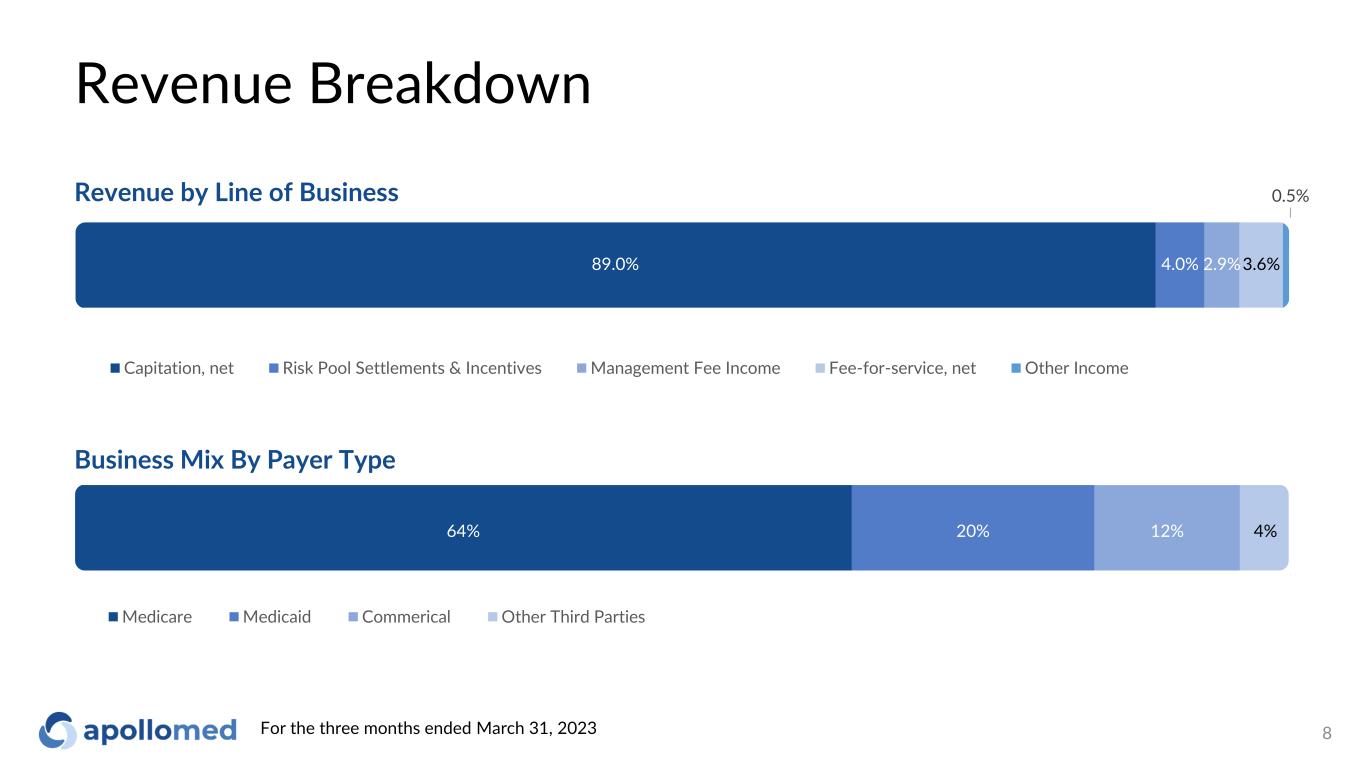
Revenue Breakdown 8For the three months ended March 31, 2023 Revenue by Line of Business Business Mix By Payer Type 89.0% 4.0% 2.9%3.6% 0.5% Capitation, net Risk Pool Settlements & Incentives Management Fee Income Fee-for-service, net Other Income 64% 20% 12% 4% Medicare Medicaid Commerical Other Third Parties
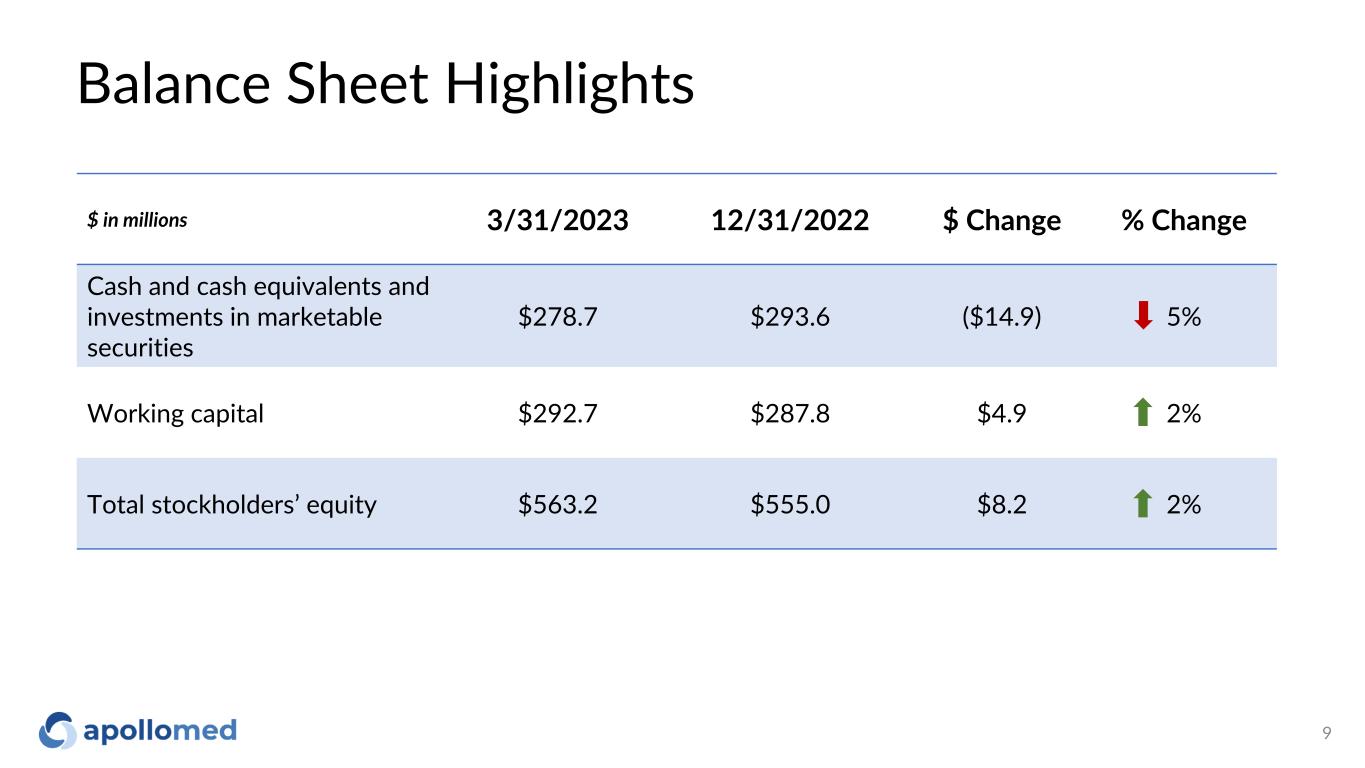
Balance Sheet Highlights 9 $ in millions 3/31/2023 12/31/2022 $ Change % Change Cash and cash equivalents and investments in marketable securities $278.7 $293.6 ($14.9) 5% Working capital $292.7 $287.8 $4.9 2% Total stockholders’ equity $563.2 $555.0 $8.2 2%
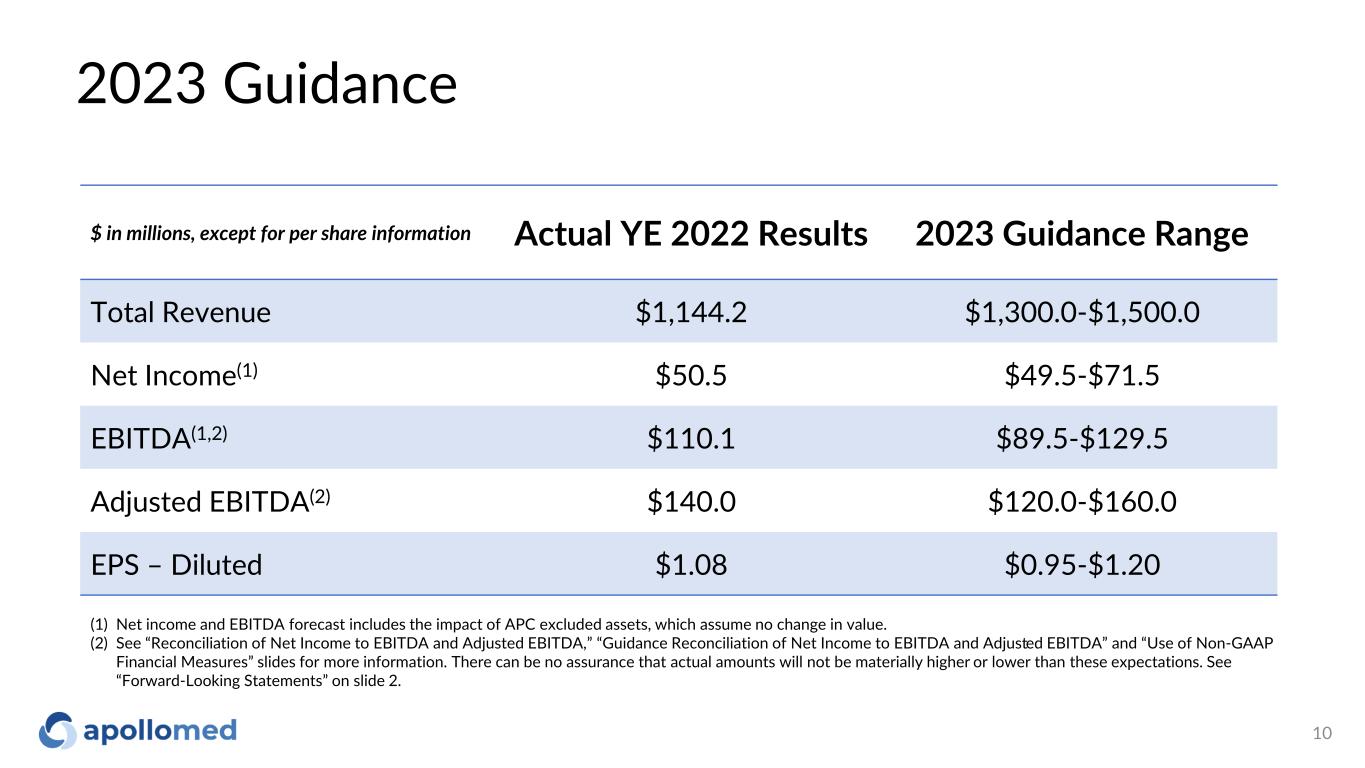
2023 Guidance 10 $ in millions, except for per share information Actual YE 2022 Results 2023 Guidance Range Total Revenue $1,144.2 $1,300.0-$1,500.0 Net Income(1) $50.5 $49.5-$71.5 EBITDA(1,2) $110.1 $89.5-$129.5 Adjusted EBITDA(2) $140.0 $120.0-$160.0 EPS – Diluted $1.08 $0.95-$1.20 (1) Net income and EBITDA forecast includes the impact of APC excluded assets, which assume no change in value. (2) See “Reconciliation of Net Income to EBITDA and Adjusted EBITDA,” “Guidance Reconciliation of Net Income to EBITDA and Adjusted EBITDA” and “Use of Non-GAAP Financial Measures” slides for more information. There can be no assurance that actual amounts will not be materially higher or lower than these expectations. See “Forward-Looking Statements” on slide 2.
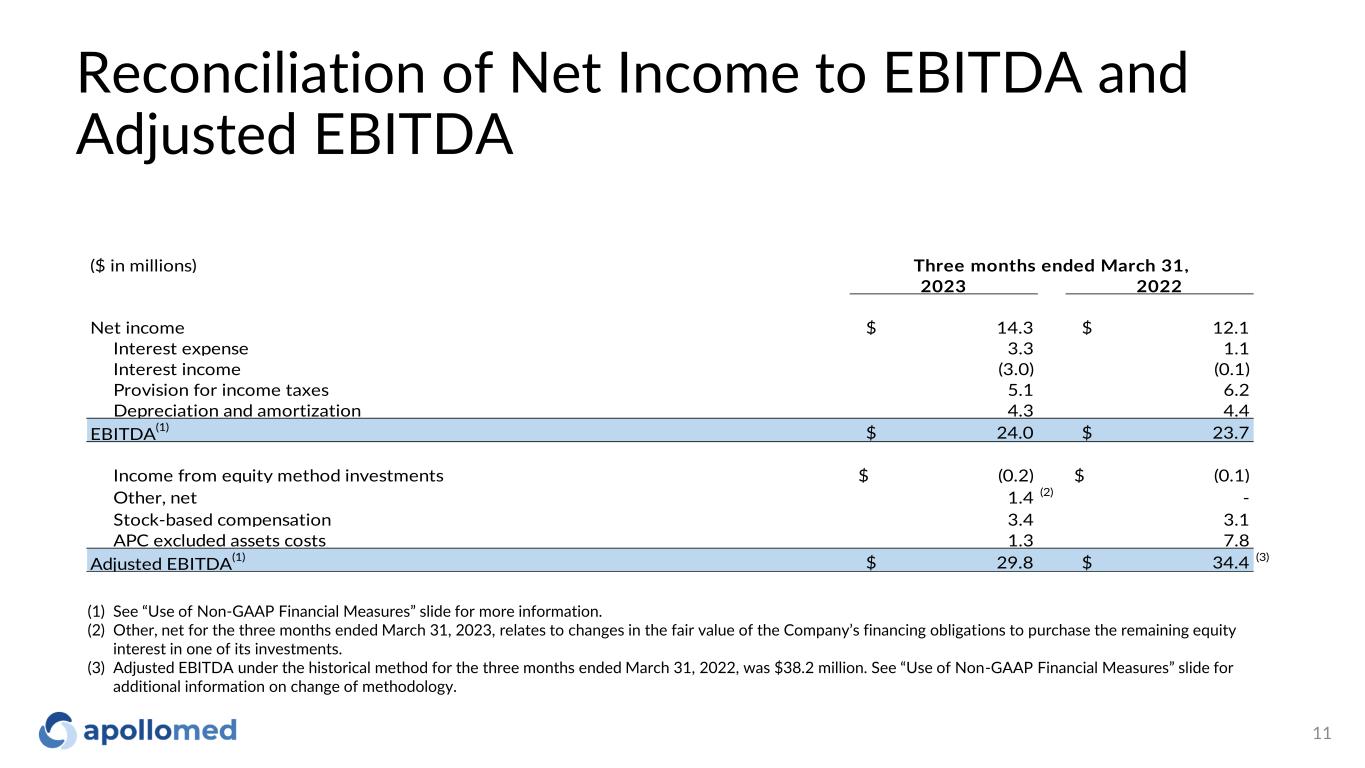
Reconciliation of Net Income to EBITDA and Adjusted EBITDA 11 (1) See “Use of Non-GAAP Financial Measures” slide for more information. (2) Other, net for the three months ended March 31, 2023, relates to changes in the fair value of the Company’s financing obligations to purchase the remaining equity interest in one of its investments. (3) Adjusted EBITDA under the historical method for the three months ended March 31, 2022, was $38.2 million. See “Use of Non-GAAP Financial Measures” slide for additional information on change of methodology. ($ in millions) 2023 2022 Net income $ 14.3 $ 12.1 Interest expense 3.3 1.1 Interest income (3.0) (0.1) Provision for income taxes 5.1 6.2 Depreciation and amortization 4.3 4.4 EBITDA(1) $ 24.0 $ 23.7 Income from equity method investments $ (0.2) $ (0.1) Other, net 1.4 (2) - Stock-based compensation 3.4 3.1 APC excluded assets costs 1.3 7.8 Adjusted EBITDA(1) $ 29.8 $ 34.4 (3) Three months ended March 31,
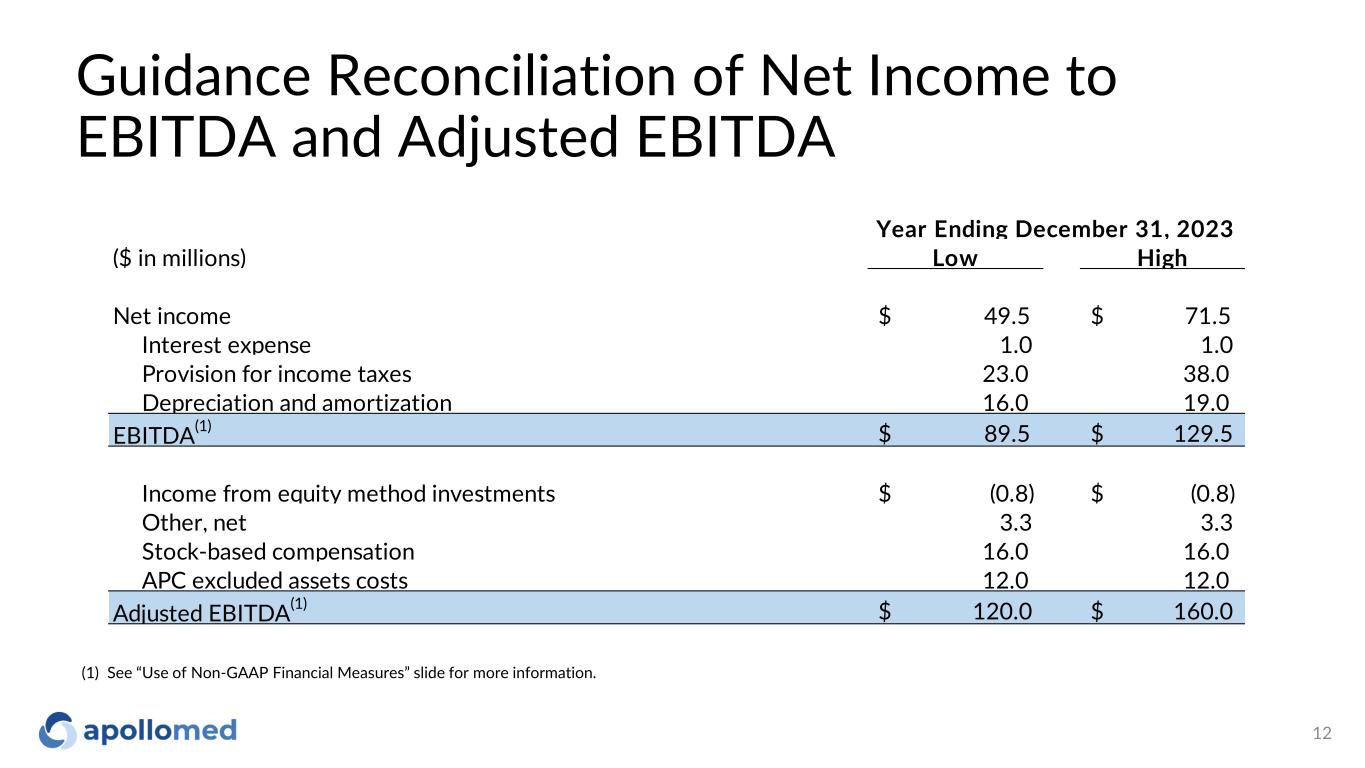
Guidance Reconciliation of Net Income to EBITDA and Adjusted EBITDA 12 (1) See “Use of Non-GAAP Financial Measures” slide for more information. ($ in millions) Low High Net income $ 49.5 $ 71.5 Interest expense 1.0 1.0 Provision for income taxes 23.0 38.0 Depreciation and amortization 16.0 19.0 EBITDA(1) $ 89.5 $ 129.5 Income from equity method investments $ (0.8) $ (0.8) Other, net 3.3 3.3 Stock-based compensation 16.0 16.0 APC excluded assets costs 12.0 12.0 Adjusted EBITDA(1) $ 120.0 $ 160.0 Year Ending December 31, 2023
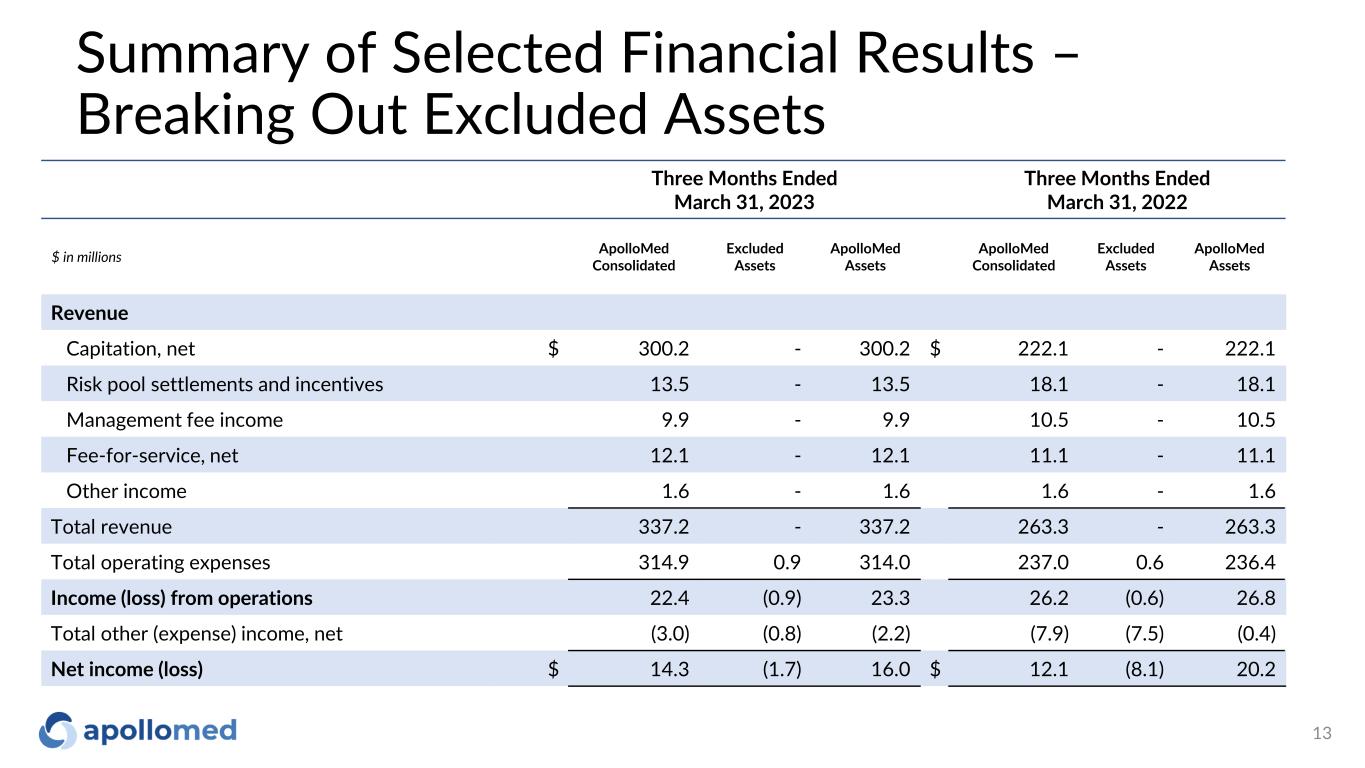
13 Three Months Ended March 31, 2023 Three Months Ended March 31, 2022 $ in millions ApolloMed Consolidated Excluded Assets ApolloMed Assets ApolloMed Consolidated Excluded Assets ApolloMed Assets Revenue Capitation, net $ 300.2 - 300.2 $ 222.1 - 222.1 Risk pool settlements and incentives 13.5 - 13.5 18.1 - 18.1 Management fee income 9.9 - 9.9 10.5 - 10.5 Fee-for-service, net 12.1 - 12.1 11.1 - 11.1 Other income 1.6 - 1.6 1.6 - 1.6 Total revenue 337.2 - 337.2 263.3 - 263.3 Total operating expenses 314.9 0.9 314.0 237.0 0.6 236.4 Income (loss) from operations 22.4 (0.9) 23.3 26.2 (0.6) 26.8 Total other (expense) income, net (3.0) (0.8) (2.2) (7.9) (7.5) (0.4) Net income (loss) $ 14.3 (1.7) 16.0 $ 12.1 (8.1) 20.2 Summary of Selected Financial Results – Breaking Out Excluded Assets
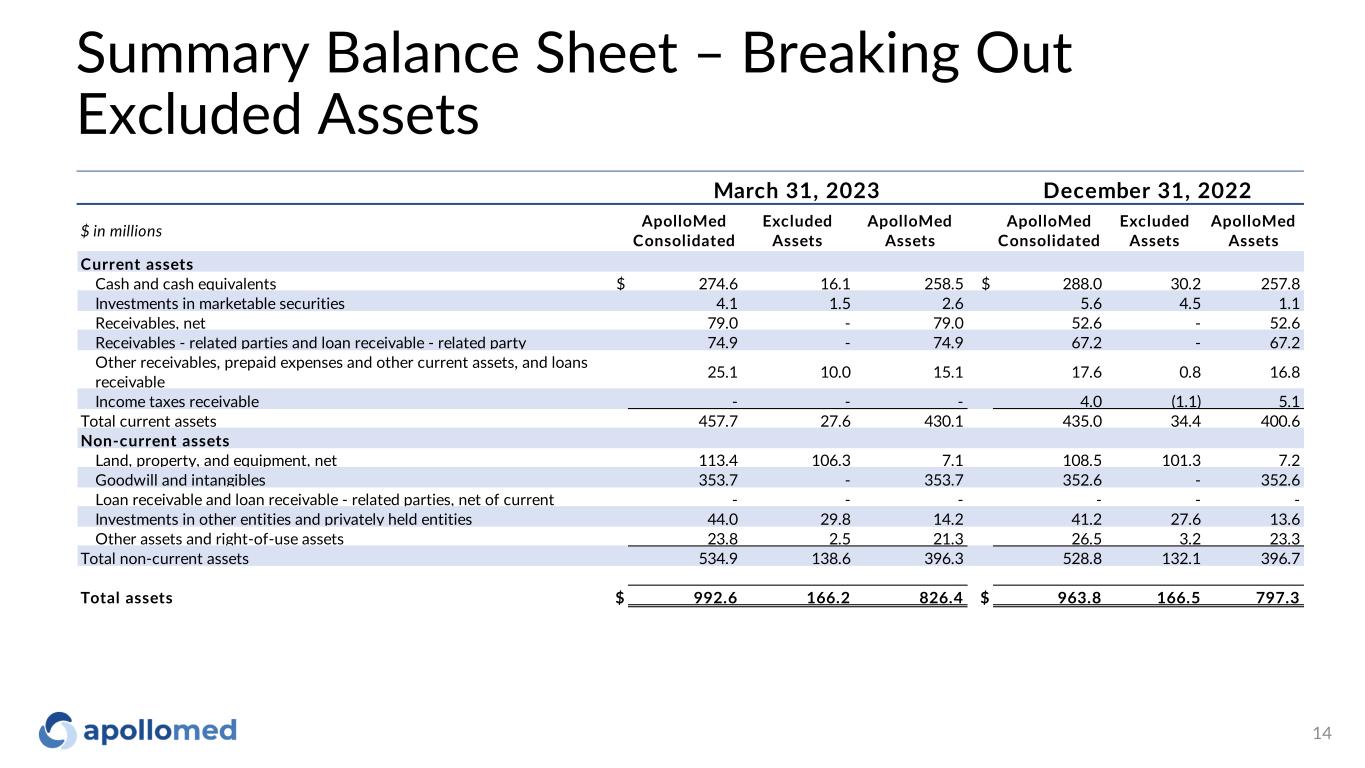
14 Summary Balance Sheet – Breaking Out Excluded Assets $ in millions ApolloMed Consolidated Excluded Assets ApolloMed Assets ApolloMed Consolidated Excluded Assets ApolloMed Assets Current assets Cash and cash equivalents $ 274.6 16.1 258.5 $ 288.0 30.2 257.8 Investments in marketable securities 4.1 1.5 2.6 5.6 4.5 1.1 Receivables, net 79.0 - 79.0 52.6 - 52.6 Receivables - related parties and loan receivable - related party 74.9 - 74.9 67.2 - 67.2 Other receivables, prepaid expenses and other current assets, and loans receivable 25.1 10.0 15.1 17.6 0.8 16.8 Income taxes receivable - - - 4.0 (1.1) 5.1 Total current assets 457.7 27.6 430.1 435.0 34.4 400.6 Non-current assets Land, property, and equipment, net 113.4 106.3 7.1 108.5 101.3 7.2 Goodwill and intangibles 353.7 - 353.7 352.6 - 352.6 Loan receivable and loan receivable - related parties, net of current - - - - - - Investments in other entities and privately held entities 44.0 29.8 14.2 41.2 27.6 13.6 Other assets and right-of-use assets 23.8 2.5 21.3 26.5 3.2 23.3 Total non-current assets 534.9 138.6 396.3 528.8 132.1 396.7 Total assets $ 992.6 166.2 826.4 $ 963.8 166.5 797.3 March 31, 2023 December 31, 2022
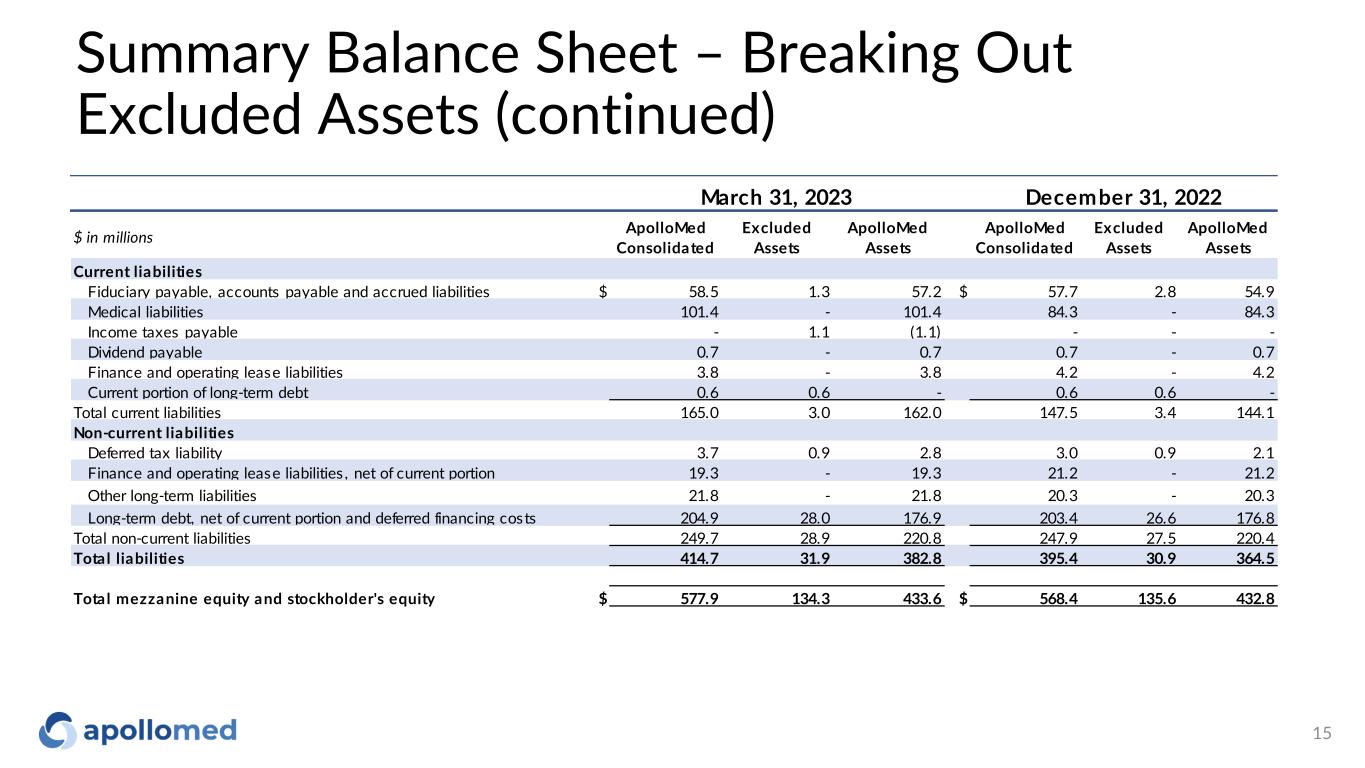
15 Summary Balance Sheet – Breaking Out Excluded Assets (continued) $ in millions ApolloMed Consolidated Excluded Assets ApolloMed Assets ApolloMed Consolidated Excluded Assets ApolloMed Assets Current liabilities Fiduciary payable, accounts payable and accrued liabilities $ 58.5 1.3 57.2 $ 57.7 2.8 54.9 Medical liabilities 101.4 - 101.4 84.3 - 84.3 Income taxes payable - 1.1 (1.1) - - - Dividend payable 0.7 - 0.7 0.7 - 0.7 Finance and operating lease liabilities 3.8 - 3.8 4.2 - 4.2 Current portion of long-term debt 0.6 0.6 - 0.6 0.6 - Total current liabilities 165.0 3.0 162.0 147.5 3.4 144.1 Non-current liabilities Deferred tax liability 3.7 0.9 2.8 3.0 0.9 2.1 Finance and operating lease liabilities , net of current portion 19.3 - 19.3 21.2 - 21.2 Other long-term liabilities 21.8 - 21.8 20.3 - 20.3 Long-term debt, net of current portion and deferred financing costs 204.9 28.0 176.9 203.4 26.6 176.8 Total non-current liabilities 249.7 28.9 220.8 247.9 27.5 220.4 Total liabilities 414.7 31.9 382.8 395.4 30.9 364.5 Total mezzanine equity and stockholder's equity $ 577.9 134.3 433.6 $ 568.4 135.6 432.8 March 31, 2023 December 31, 2022
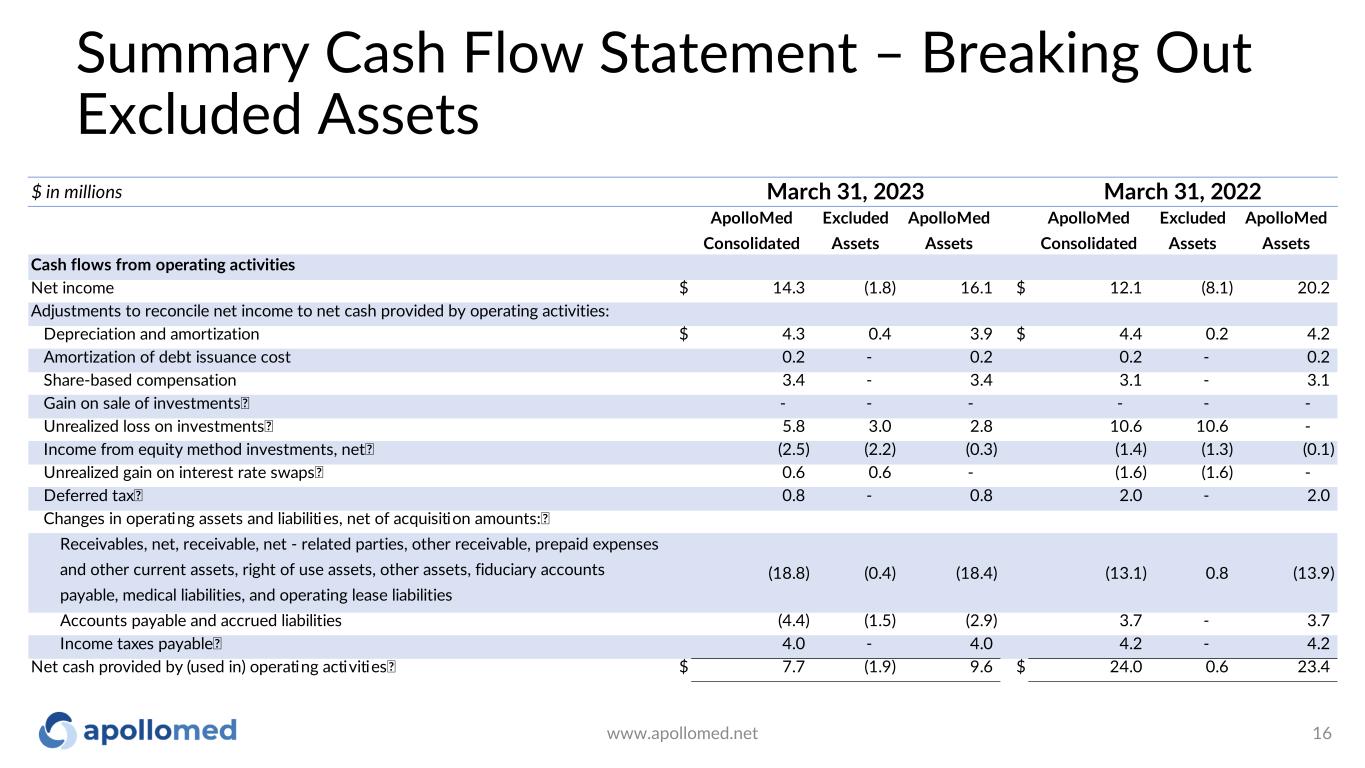
Summary Cash Flow Statement – Breaking Out Excluded Assets www.apollomed.net 16 $ in millions ApolloMed Consolidated Excluded Assets ApolloMed Assets ApolloMed Consolidated Excluded Assets ApolloMed Assets Cash flows from operating activities Net income $ 14.3 (1.8) 16.1 $ 12.1 (8.1) 20.2 Adjustments to reconcile net income to net cash provided by operating activities: Depreciation and amortization $ 4.3 0.4 3.9 $ 4.4 0.2 4.2 Amortization of debt issuance cost 0.2 - 0.2 0.2 - 0.2 Share-based compensation 3.4 - 3.4 3.1 - 3.1 Gain on sale of investments - - - - - - Unrealized loss on investments 5.8 3.0 2.8 10.6 10.6 - Income from equity method investments, net (2.5) (2.2) (0.3) (1.4) (1.3) (0.1) Unrealized gain on interest rate swaps 0.6 0.6 - (1.6) (1.6) - Deferred tax 0.8 - 0.8 2.0 - 2.0 Changes in operating assets and liabilities, net of acquisition amounts: Receivables, net, receivable, net - related parties, other receivable, prepaid expenses and other current assets, right of use assets, other assets, fiduciary accounts payable, medical liabilities, and operating lease liabilities (18.8) (0.4) (18.4) (13.1) 0.8 (13.9) Accounts payable and accrued liabilities (4.4) (1.5) (2.9) 3.7 - 3.7 Income taxes payable 4.0 - 4.0 4.2 - 4.2 Net cash provided by (used in) operating activities $ 7.7 (1.9) 9.6 $ 24.0 0.6 23.4 March 31, 2022March 31, 2023
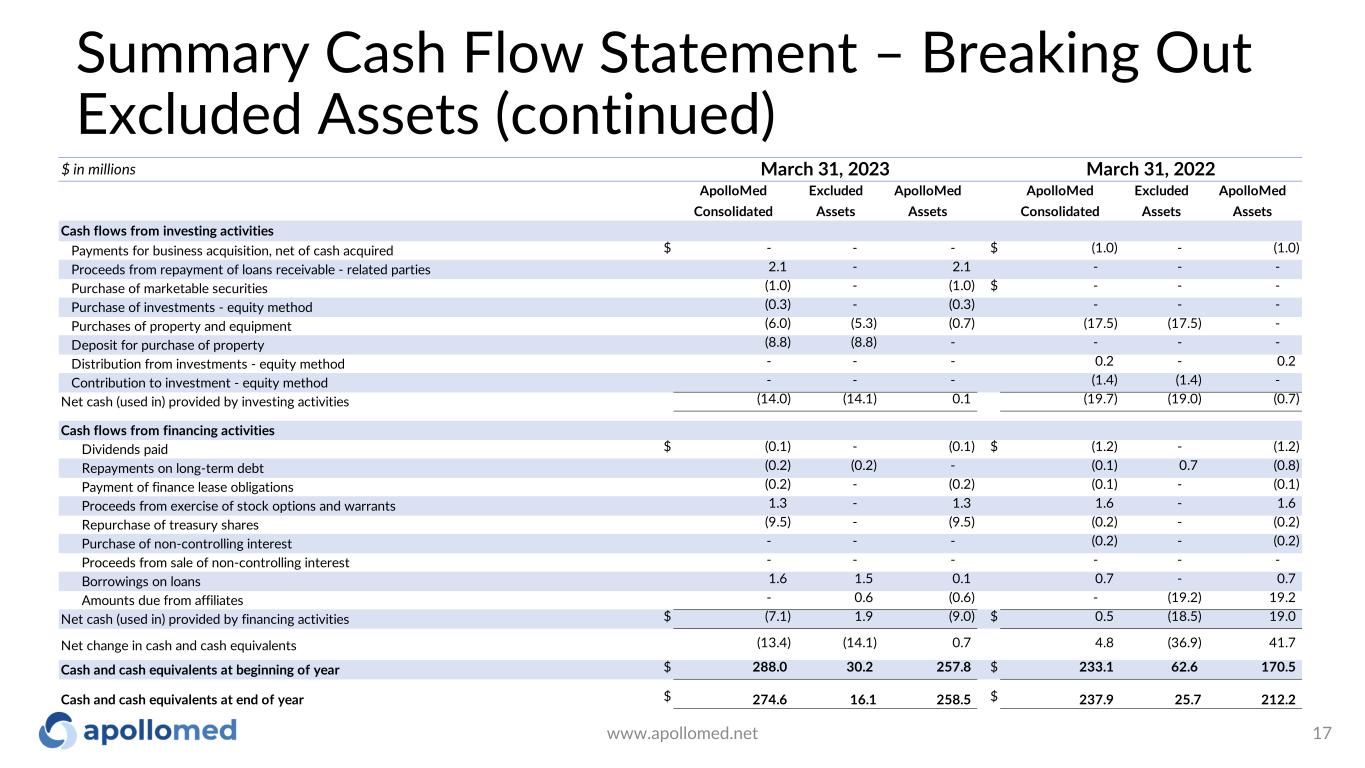
Summary Cash Flow Statement – Breaking Out Excluded Assets (continued) www.apollomed.net 17 $ in millions ApolloMed Consolidated Excluded Assets ApolloMed Assets ApolloMed Consolidated Excluded Assets ApolloMed Assets Cash flows from investing activities Payments for business acquisition, net of cash acquired $ - - - $ (1.0) - (1.0) Proceeds from repayment of loans receivable - related parties 2.1 - 2.1 - - - Purchase of marketable securities (1.0) - (1.0) $ - - - Purchase of investments - equity method (0.3) - (0.3) - - - Purchases of property and equipment (6.0) (5.3) (0.7) (17.5) (17.5) - Deposit for purchase of property (8.8) (8.8) - - - - Distribution from investments - equity method - - - 0.2 - 0.2 Contribution to investment - equity method - - - (1.4) (1.4) - Net cash (used in) provided by investing activities (14.0) (14.1) 0.1 (19.7) (19.0) (0.7) Cash flows from financing activities Dividends paid $ (0.1) - (0.1) $ (1.2) - (1.2) Repayments on long-term debt (0.2) (0.2) - (0.1) 0.7 (0.8) Payment of finance lease obligations (0.2) - (0.2) (0.1) - (0.1) Proceeds from exercise of stock options and warrants 1.3 - 1.3 1.6 - 1.6 Repurchase of treasury shares (9.5) - (9.5) (0.2) - (0.2) Purchase of non-controlling interest - - - (0.2) - (0.2) Proceeds from sale of non-controlling interest - - - - - - Borrowings on loans 1.6 1.5 0.1 0.7 - 0.7 Amounts due from affiliates - 0.6 (0.6) - (19.2) 19.2 Net cash (used in) provided by financing activities $ (7.1) 1.9 (9.0) $ 0.5 (18.5) 19.0 Net change in cash and cash equivalents (13.4) (14.1) 0.7 4.8 (36.9) 41.7 Cash and cash equivalents at beginning of year $ 288.0 30.2 257.8 $ 233.1 62.6 170.5 Cash and cash equivalents at end of year $ 274.6 16.1 258.5 $ 237.9 25.7 212.2 March 31, 2022March 31, 2023
Use of Non-GAAP Financial Measures This presentation contains the non-GAAP financial measures EBITDA and Adjusted EBITDA, of which the most directly comparable financial measure presented in accordance with U.S. generally accepted accounting principles (“GAAP”) is net income. These measures are not in accordance with, or alternatives to GAAP, and may be different from other non-GAAP financial measures used by other companies. The Company uses Adjusted EBITDA as a supplemental performance measure of our operations, for financial and operational decision-making, and as a supplemental means of evaluating period-to- period comparisons on a consistent basis. Adjusted EBITDA is calculated as earnings before interest, taxes, depreciation, and amortization, excluding income or loss from equity method investments, non-recurring transactions, stock-based compensation, and APC excluded assets costs. Beginning in the third quarter ended September 30, 2022, the Company has revised the calculation for Adjusted EBITDA to exclude provider bonus payments and losses from recently acquired IPAs, which it believes to be more reflective of its business. The Company believes the presentation of these non-GAAP financial measures provides investors with relevant and useful information, as it allows investors to evaluate the operating performance of the business activities without having to account for differences recognized because of non-core or non-recurring financial information. When GAAP financial measures are viewed in conjunction with non-GAAP financial measures, investors are provided with a more meaningful understanding of the Company’s ongoing operating performance. In addition, these non-GAAP financial measures are among those indicators the Company uses as a basis for evaluating operational performance, allocating resources, and planning and forecasting future periods. Non- GAAP financial measures are not intended to be considered in isolation, or as a substitute for, GAAP financial measures. To the extent this release contains historical or future non-GAAP financial measures, the Company has provided corresponding GAAP financial measures for comparative purposes. The reconciliation between certain GAAP and non-GAAP measures is provided above. 18

19 For inquiries, please contact: ApolloMed Investor Relations (626) 943-6491 investors@apollomed.net Carolyne Sohn, The Equity Group (408) 538-4577 csohn@equityny.com